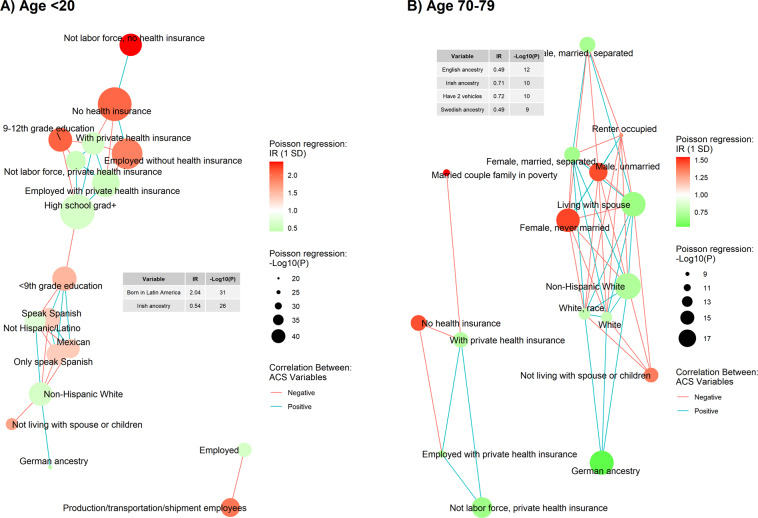
Fig. 3. Network of two age groups (<20 and 70–79).
Each graph consisted of the twenty American Community Survey (ACS) variables most significantly associated with the age-specific COVID-19 incidence. The associations between each ACS variable and the age-specific COVID-19 cumulative incidence were presented as specific color and size of node. Network was built based on the correlation between ACS variable. The network graphs of two age groups (A) <20 and (B) 70–79 were shown here. The networks for all age groups were available in the supplementary material (Figure S2-S9).

