
Figure 2.
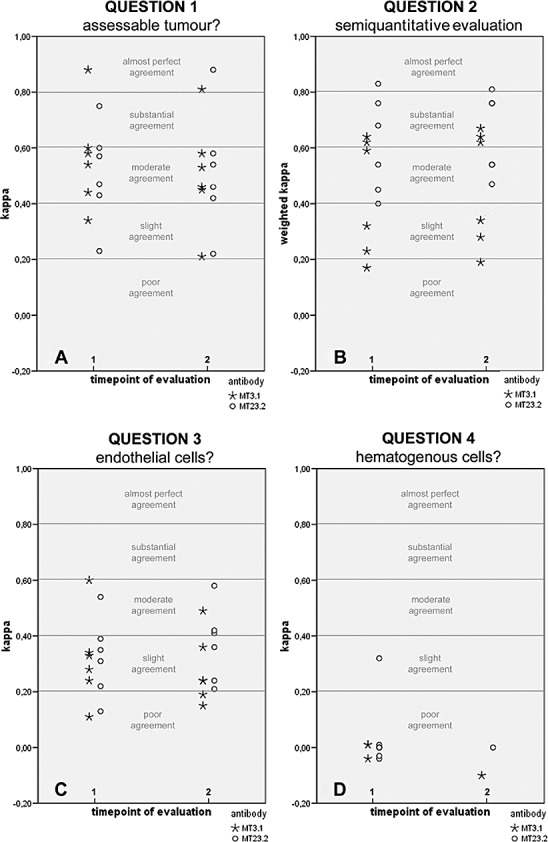
Illustration of kappa values for interobserver agreement on immunohistochemically visualized O6‐methylguanine‐methyltransferase protein expression in tissue microarray. (For a detailed description, refer to Results section.) Note that for question 2 (B), there are two kappa value ties at timepoint 2 with MT3.1 antibody. Therefore, only four instead of the expected six symbols (four observers = six observer pairs) are shown. For question 4 (D), less than six kappa values are shown for each antibody and timepoint because some observers showed no variation in an assessment run (ie, always voted solely “yes” or “no”). In such cases, no kappa values were computed.