
Figure 4.
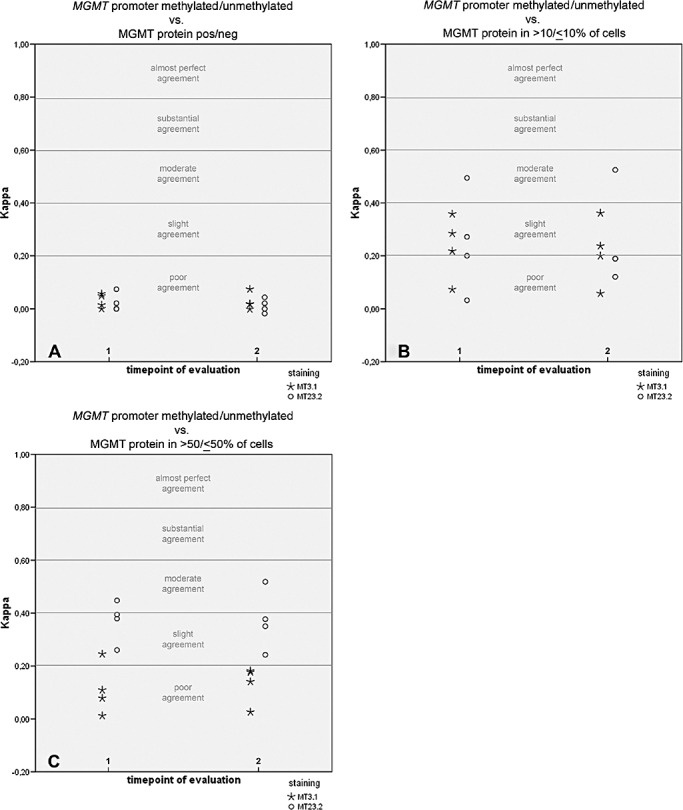
Illustration of kappa values for correlation between immunohistochemically visualized O6‐methylguanine‐methyltransferase (MGMT) protein expression and MGMT gene promoter status as assessed by methylation‐specific PCR. Immunohistochemical MGMT values were categorized in three different ways (for a detailed description, refer to Results section): MGMT negative vs. MGMT positive (A), low vs. high MGMT expression (cutoff 10%; B), MGMT expression in <50% of tumor cells vs. MGMT expression in ≥50% of tumor cells (C). Note that in A, there is one kappa value tie for the MT3.1 antibody at both timepoints, respectively, and one tie for the MT23.2 antibody at timepoint 1. In B, there is one kappa value tie at timepoint 2 with the MT23.2 antibody.