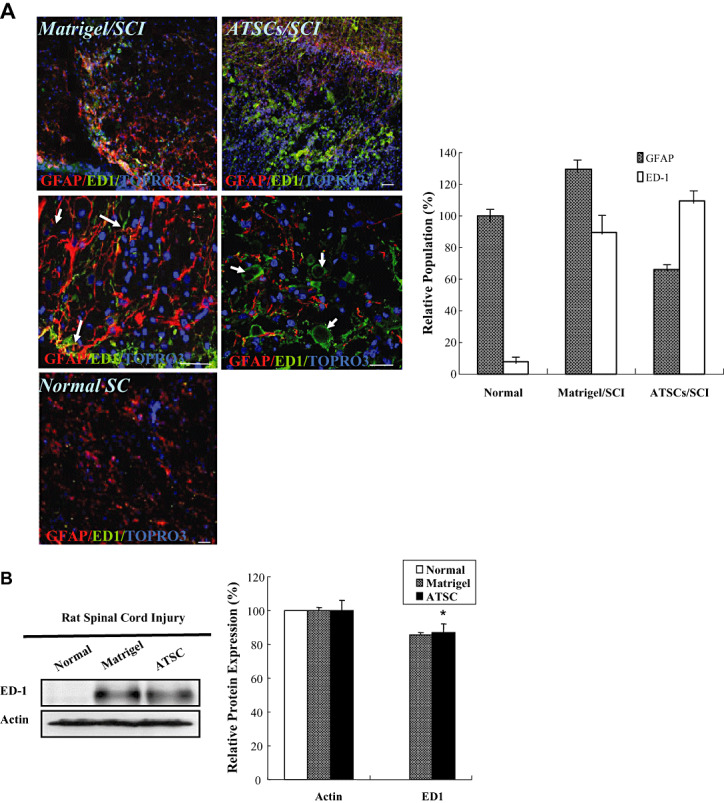
Figure 3.

Macrophage and glial cell infiltration/activation at the site of spinal cord injury. A. Confocal images of spinal cord tissue sections from the lesion epicenter stained with antibodies against GFAP (red), ED‐1 (green) and counter stained with Topro‐3 (blue). The number of GFAP‐positive and ED‐1 positive cells relative to the total number of Topro 3 positive cells was determined by counting and the mean ± the standard deviation plotted. Scale bar = 20 µm. B. Western blot analysis of spinal cord tissue extracts prepared from uninjured, control animals or animals subjected to spinal cord injury (SCI) and treated with Matrigel alone or Matrigel + adipose tissue stromal cell (ATSC) extract. Expression levels of ED1 protein were quantified by densitometry and normalized to that of Actin (*P < 0.05). ED‐1 macrophage and microglial cells (arrows) are indicated. Middle column shows an enlarged picture of control SC2 (Matrigel/SC2; left) and ATSCs extract treated SC2: ATSCs/SC2; right).
