
Figure 4.
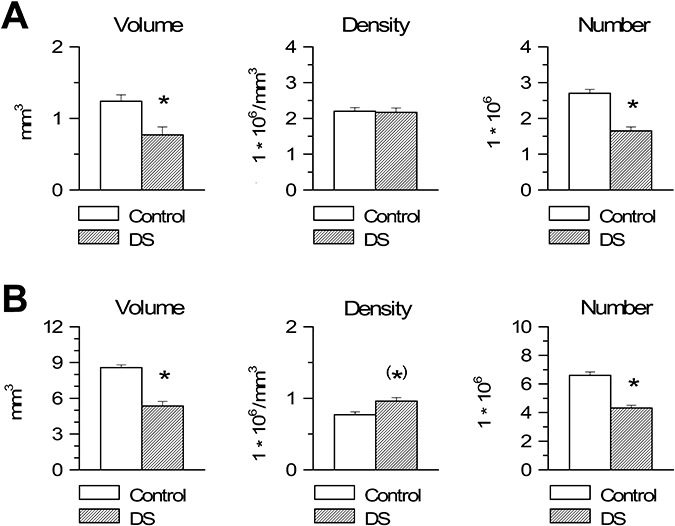
Stereology of the dentate gyrus and hippocampus in Down syndrome (DS) and control fetuses. A,B. Volume (panels on the left), cell density, expressed as number of cells/mm3 (middle panels) and total number of cells (panels on the right) of the granule cell layer (A) and pyramidal layer (B) in DS and control fetuses. Values are mean ± SEM. (*)P < 0.06; *P < 0.05 (two‐tailed t‐test).