
Figure 7.
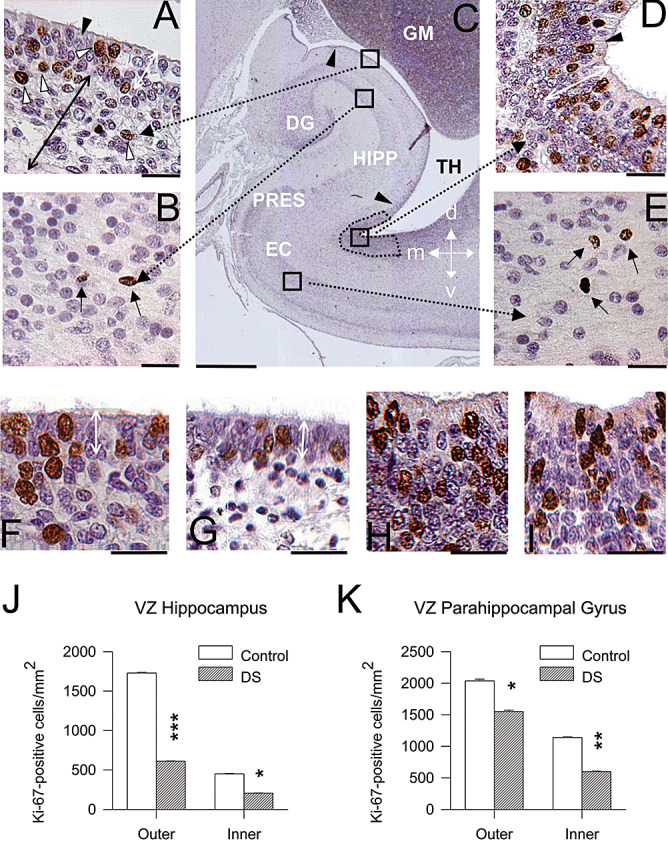
Cell proliferation in the hippocampal region of DS and control fetuses. A–E. Coronal sections across the hippocampal region of a control fetus (case 104) immunostained for Ki‐67 and counterstained with Mayer's Haematoxylin. Images in A, B, D and E are higher magnification of the regions enclosed by squares in C. Cells immunostained for Ki‐67 appear labeled in brown: for instance, the cells indicated by the white arrowheads in A and black arrows in B and E. Cells indicated by the black arrowhead in A and D are ependymal cells. The arrowheads in C mark the border of the ventricular zone of the hippocampus and the stippled area indicates the region of the ventricular zone of the PHG where proliferating cells were sampled. The double‐headed white arrow in A and D indicates the outer portion of the ventricular zone. The double‐headed black arrow in A indicates the inner portion of the hippocampal ventricular zone. F–I. Examples of sections immunostained for Ki‐67 and counterstained with Mayer's Haematoxylin from the ventricular zone overlying the hippocampus in a control (F) and a DS (G) fetus and from the outer ventricular zone of the PHG in a control (H) and a DS (I) fetus. Images are from cases 104 (F,H) and 203 (G,I). The double‐headed white arrow in F and G indicates the outer portion of the ventricular zone of the hippocampus. Calibration: A, B, D, E, F–I = 25 µm; and C = 1000 µm. J,K. Density of Ki‐67‐positive cells, expressed as number of cells/mm2 in the outer and inner ventricular zone of the hippocampus (J) and PHG (K). Values are mean ± SEM. *P < 0.05; **P < 0.01; ***P < 0.001 (two‐tailed t‐test). Abbreviations: d = dorsal; DG = dentate gyrus; EC = entorhinal cortex; GM = germinal matrix; HIPP = hippocampus; l = lateral; m = medial; PHG = parahippocampal gyrus; PRES = presubiculum; TH = temporal horn of the lateral ventricle; v = ventral.