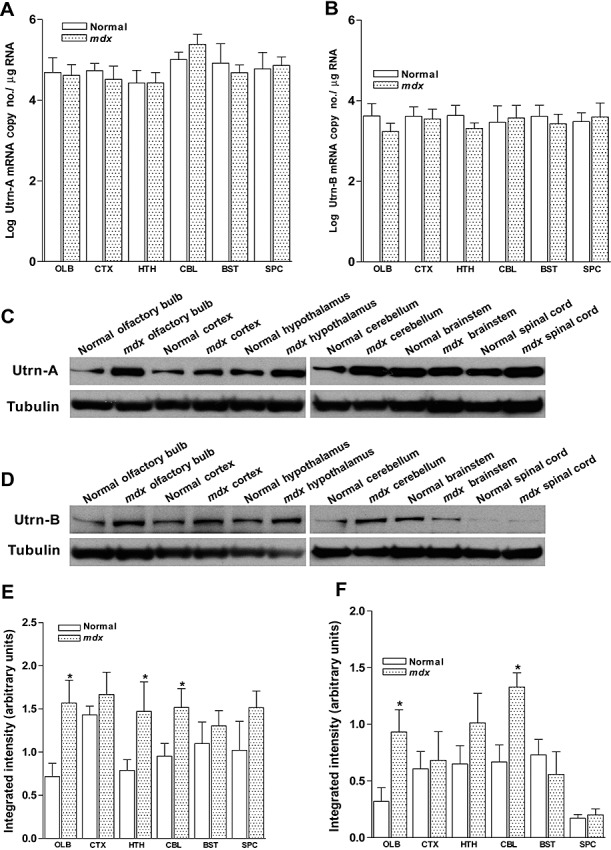
Figure 6.

Quantitation of utrophin expression in normal and mdx mouse central nervous system (CNS). A,B. Expression levels of Utrn‐A and Utrn‐B mRNAs in olfactory bulb (OLB), cortex (CTX), hypothalamus (HTH), cerebellum (CBL), brainstem (BST) and the spinal cord (SPC) of normal and mdx mice did not show any significant differences in mdx mice compared with normal mice. Mean ± SD are shown. C,D. Western blot analysis of brain lysates of normal and mdx mouse containing 50 µg of total protein probed with Utrn‐A and Utrn‐B antibodies. Different regions of the CNS showed mild to moderate degree of upregulation in regions studied except for the brain stem (for Utrn‐A) and spinal cord (for Utrn‐B), were levels were similar in normal and mdx mice. Further, densitometric analysis of Utrn‐A (E) and Utrn‐B (F), expressed as normalized value of Utrn‐A/tubulin and Utrn‐B/tubulin respectively, revealed significant upregulation of Utrn‐A in the olfactory bulb, hypothalamus and cerebellum of mdx mouse, while Utrn‐B protein was upregulated only in the olfactory bulb and cerebellum. Histograms show means ± standard deviation. Statistical analysis were conducted using Student's t‐tests. Lower lanes show blots probed with tubulin antibodies. Each blot is a representative immunoblot from minimum of four experiments. *P < 0.05.
