
Figure 1.
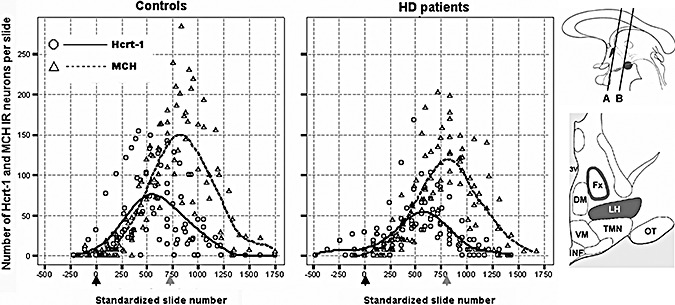
Distribution patterns of hypocretin‐1 (Hcrt‐1) and melanin‐concentrating hormone (MCH) immunoreactive (IR) neurons in the lateral hypothalamus of the controls and the Huntington disease (HD) patients. In order to present data from all subjects in the same diagrams, the individual distribution patterns were standardized in rostrocaudal direction for the anatomic distance between the point where the fornix abuts the paraventricular nucleus (black arrows; at the level of line “A” in the upper cartoon) and the fornicomamillary junction (grey arrows; at the level of line “B” in the upper cartoon). This procedure was performed separately for the control and the HD group. In addition, local linear regression was used to fit curves to the standardized pooled data in order to clarify the underlying distribution patterns (kernel = Gaussian, bandwidth value = 1.0). Note that the overall rostrocaudal dispersion of hypocretin‐1 and MCH IR neurons does not appear to be noticeably different between the control and the HD subjects. Upper cartoon. A schematic sagittal view of the hypothalamus; the paraventricular nucleus and the mamillary bodies are indicated in dark. Lower cartoon. A schematic coronal view of the hypothalamus midway between lines “A” and “B” in the upper cartoon; the perifornical area and the lateral hypothalamus are indicated in dark [adapted from (36)]. 3V = third ventricle; Fx = fornix; LH = lateral hypothalamus; DM = dorsomedial nucleus; VM = ventromedial nucleus; TMN = tuberomamillary nucleus; INF = infundibular nucleus; OT = optic tract.