
Figure 2.
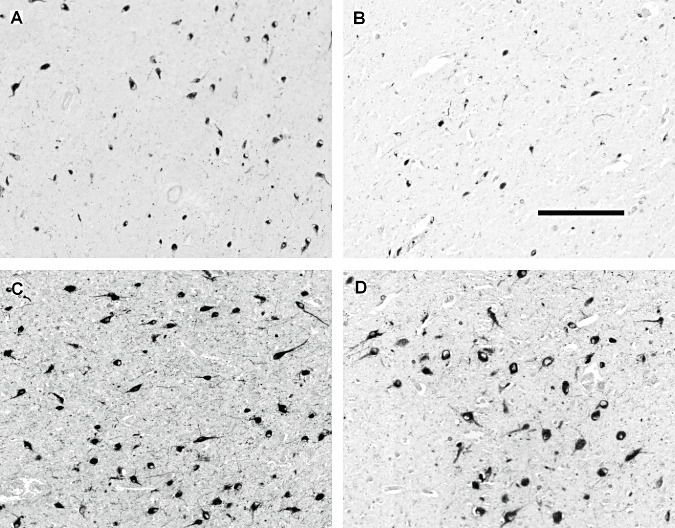
Representative photographs of hypocretin‐1 and melanin‐concentrating hormone (MCH) immunoreactive (IR) neurons in the lateral hypothalamus of two control subjects (A and C, #C‐4 and #C‐2 respectively) and two patients with Huntington disease (HD) (B and D, #HD‐6 and #HD‐1 respectively) with neuronal counts at or around the median (Table 1). The pictures were taken from the slides with the highest numbers of IR neurons. The illustrations show a modest reduction in the number of hypocretin‐1 IR neurons in the HD brain (A,B) while the number of MCH IR neurons is not significantly affected (C,D). Scale bar: 250 µm.