
Figure 1.
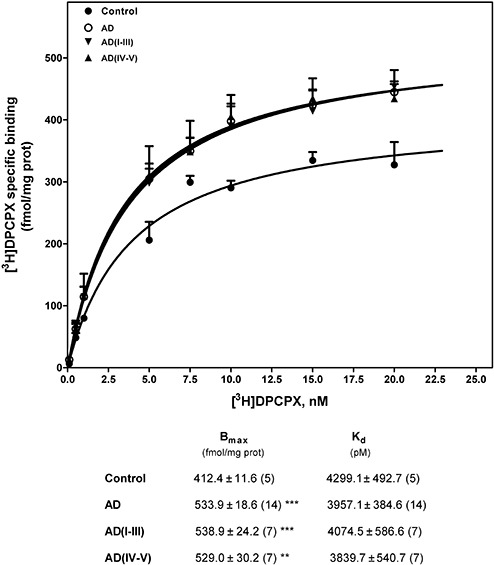
Adenosine A1 receptor detection in frontal cortex brain from Alzheimer's disease (AD). Saturation curves of [3H]DPCPX binding to plasma membranes were performed by incubation of 50–75 µg of membranes from control and AD brains with increasing concentrations of the radioligand, as described in Materials and methods. Total receptor number (Bmax) and receptor affinity (Kd) determined by Scatchard and non‐lineal regression analysis are shown in the inset. Data are mean ± SEM of control and AD cases performed in triplicate using different plasma membrane isolations. **P < 0.01 and ***P < 0.001 significantly different from control value.