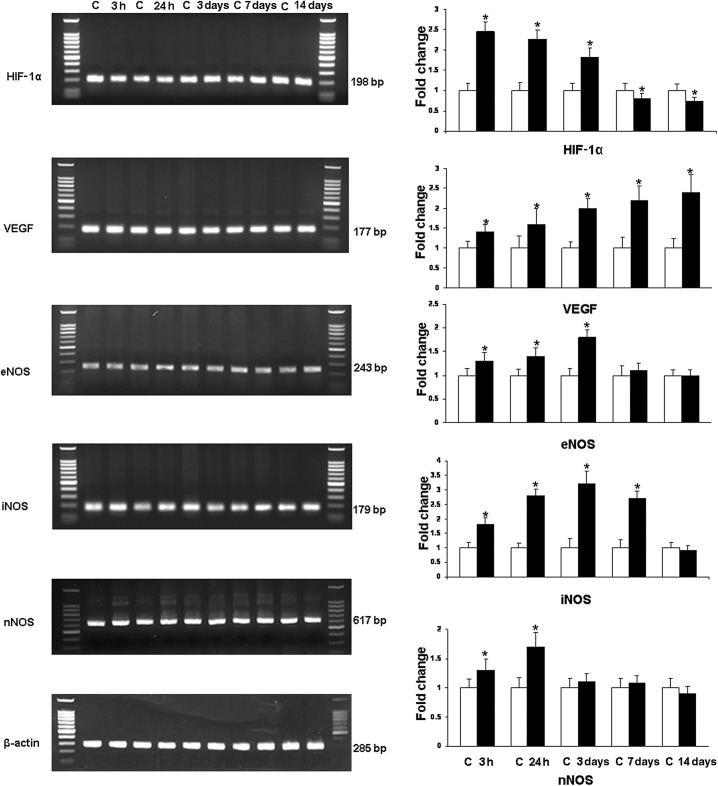
Figure 1.
RT‐PCR analysis of the hypoxia inducible factor‐1α (HIF‐1α), vascular endothelial growth factor (VEGF), endothelial (eNOS), inducible (iNOS) and neuronal (nNOS) nitric oxide synthase gene expression in the hippocampus of rats subjected to hypoxia. The left panel represents 1.5% agarose gel stained with ethidium bromide of RT‐PCR products of the above mentioned mRNA in the hippocampus of rats at 3 and 24 h, and 3, 7 and 14 days after the hypoxic exposure and their corresponding controls. The right panel shows the graphical representation of fold changes quantified by normalization to the β‐actin as an internal control. Each bar represents the mean ± standard deviation. Differences in the mRNA levels are significant (*P < 0.05) after the hypoxic exposure when compared with the controls.

