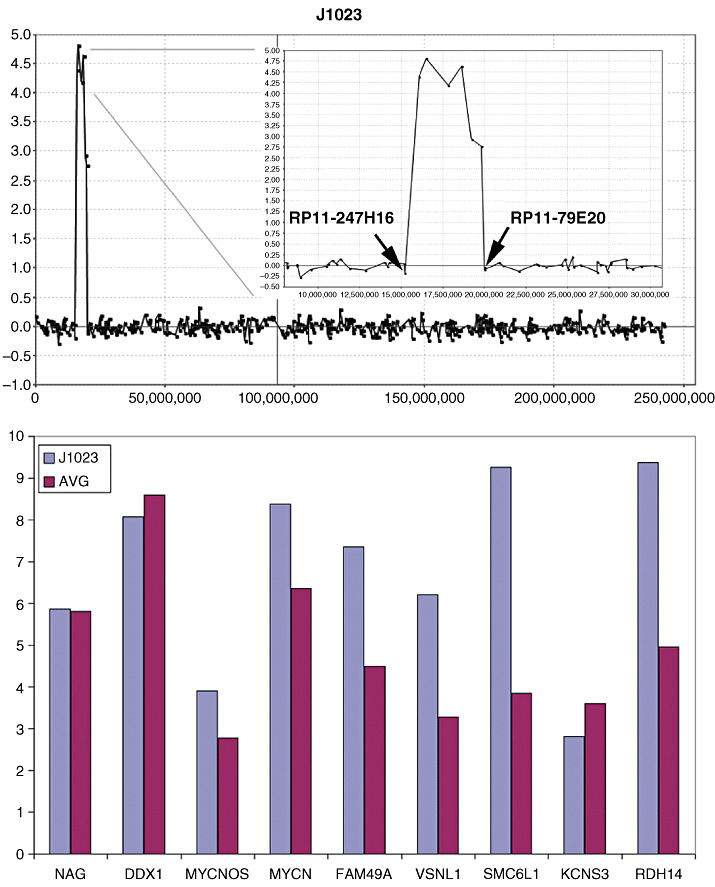
Figure 2.

Amplification in 2p23 in tumor J1023. A 4.5 Mbp region shows an approximately 30‐fold increase (Log2 scale) in DNA content in this tumor (top). which demonstrates relatively equal level amplification across the region (inset, top) defined by the end points of the flanking uninvolved BACs. Gene expression analysis from the U133A arrays identifies genes at the proximal end of the amplicon which have increases in expression levels compared with tumors which do not show amplification in this region.
