
Figure 9.
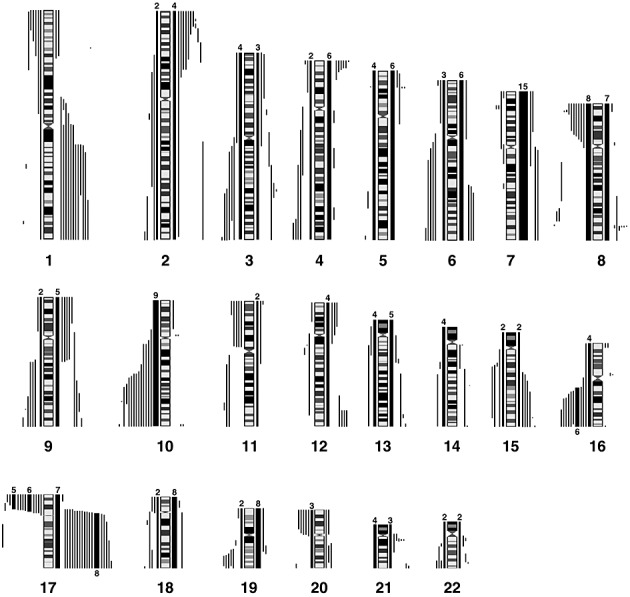
Summary of the losses and gains seen in an extended series of medulloblastomas analyzed by aCGH using the RPCI 6K platform. Each bar, drawn to scale, represents the extent of the losses (shown on the left of the ideograms) and the gains (shown on the right of the ideograms). Whole chromosome changes are included where the width of the bar represents the frequency of the event with the actual number of tumors showing this particular event shown above the bar. High Levels amplifications are described separately in Table 2.