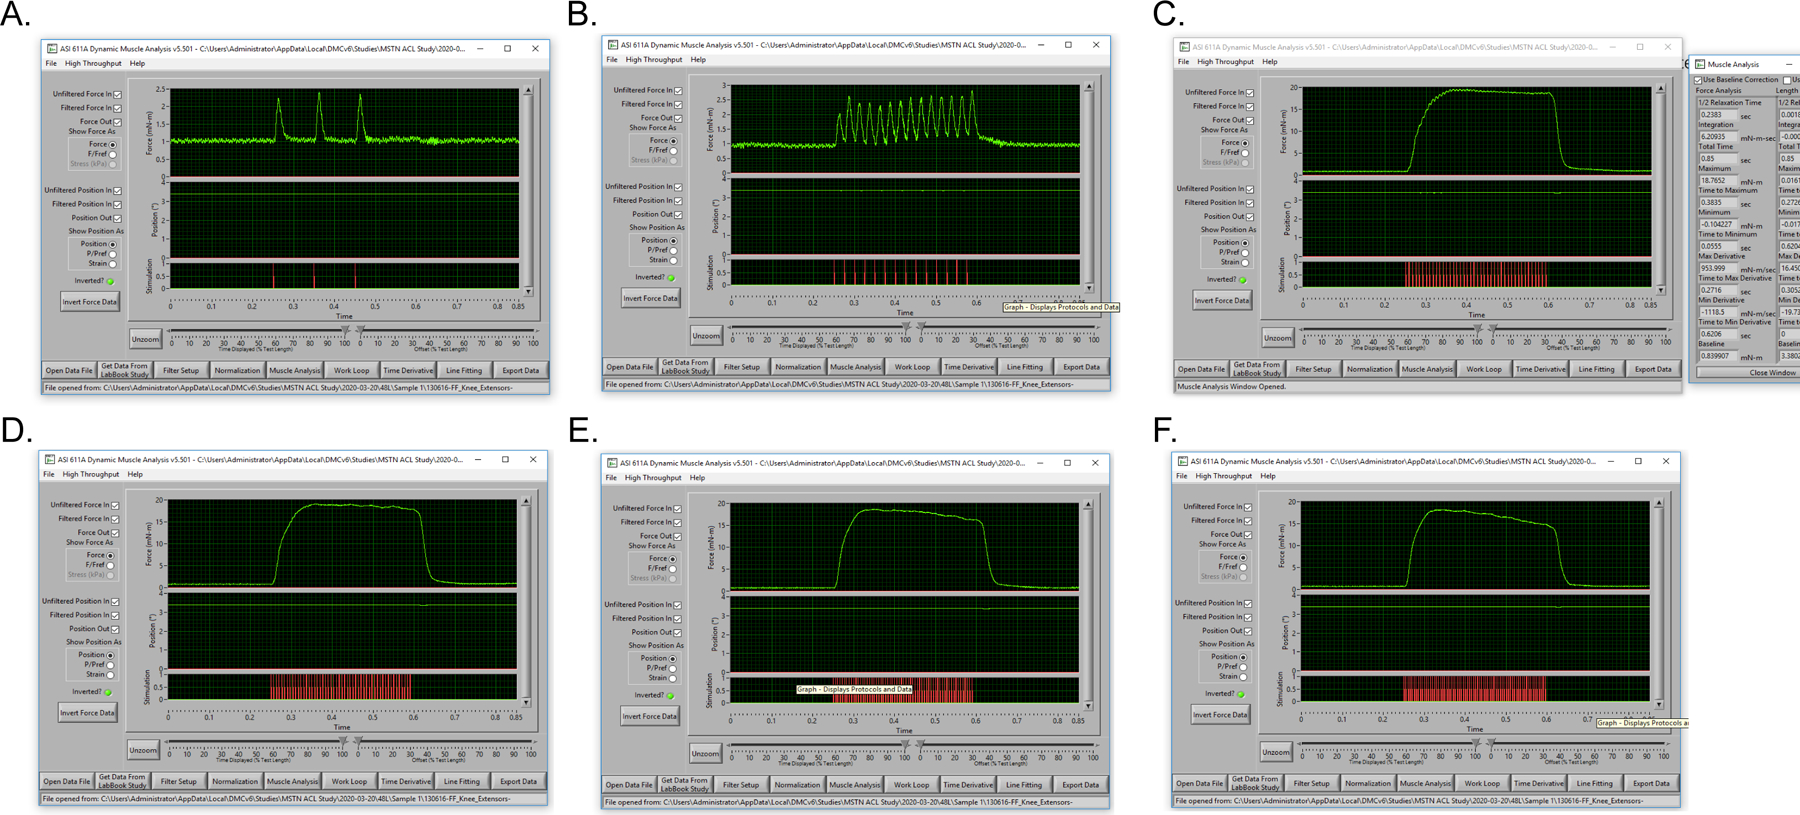
Figure 5: Representative tetanic torque curves throughout a torque-frequency experiment for the same mouse.

(A) Submaximal isometric tetanic torque produced at 10 Hz. (B) Submaximal isometric tetanic torque at 40 Hz. (C) Peak isometric tetanic torque output at 120 Hz. (D) Isometric tetanic torque at 150 Hz. (E) Isometric tetanic torque at 180 Hz. (F) Isometric tetanic torque at 200 Hz.
