. 2021 Mar 23;21(9):1694–1705. doi: 10.1039/d0lc01288b

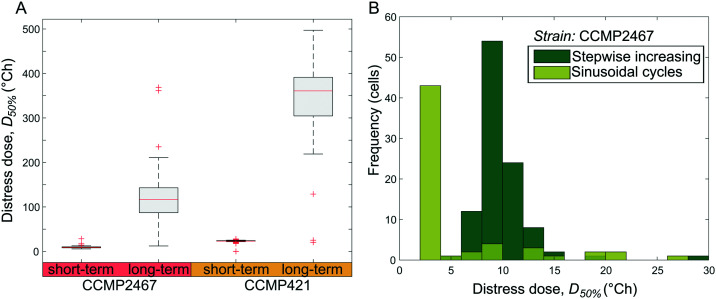
Fig. 6. Thermal dose analysis reveals the heat tolerance of cells exposed to different temperature profiles. (A) The distress dose, D50% (the thermal dose at which cells' Fv/Fm values drop below 50% of their pre-stimulus Fv/Fm for the first time), is compared for short-term and long-term stepwise increasing temperature profiles for two Symbiodinium strains (CCMP421 and CCMP2467). The data show that long-term exposures of cells result in higher heat tolerance than short-term exposures. The central mark on each box is the median, the edges of the box are the 25th and 75th percentiles, the whiskers extend to the most extreme data points considered not to be outliers, and the outliers are plotted individually as red crosses. (B) Histogram distribution of distress doses, D50%, for cells exposed to short-term increasing and sinusoidal varying temperatures shows that the heat tolerance depends on the shape of the thermal exposure profile. Note that these two experiments were designed to give the same total dose for the same total time.

Fig. 6