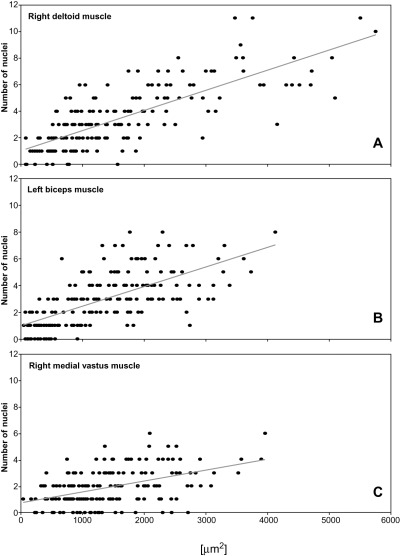
Figure 5.

Case 1. The cross‐sectional area of an individual myofiber is plotted against the total number of its nuclei to compare the nuclear number‐to‐cytoplasmic area between myofibers of different sizes. Each dot represents a muscle fiber (n = 200). Regression lines indicate the slope trend in each muscle. The nuclear number‐to‐cytoplasmic area increases with increasing myofiber cross‐sectional area.
