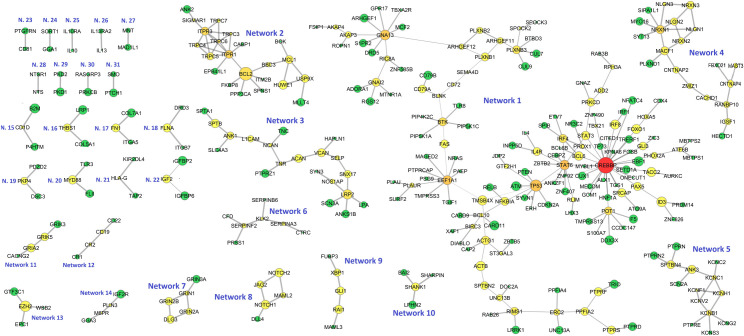
Fig 3. Representation of all significantly mutated protein subnetworks according to Hierarchical HotNet results.
Node size is proportional to mutation frequency, node color is proportional to node degree (red: higher degree values, green: lower degree values) and edge width is proportional to betweenness centrality.

