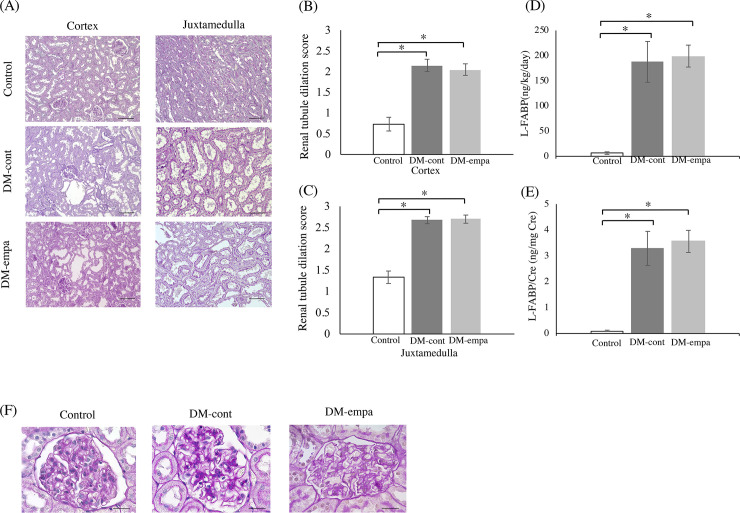
Fig 4. Assessment of renal histology and renal tubule dilation scores and urinary excretion of L-FABP after empagliflozin treatment.
(A) Histology of the renal cortex and juxtamedulla. Sections were stained with PAS stain. Scale bar: 100μm. Renal tubule dilation scores of the cortex (B) and juxtamedulla (C). Urinary excretion of L-FABP for 24 hours (D, relative to body weight; E, relative to creatinine excretion). * p<0.05 vs Control. (F) Typical glomerular structure of control, DM-cont and DM-empa. Sections were stained with PAS stain. Scale bar: 20μm.

