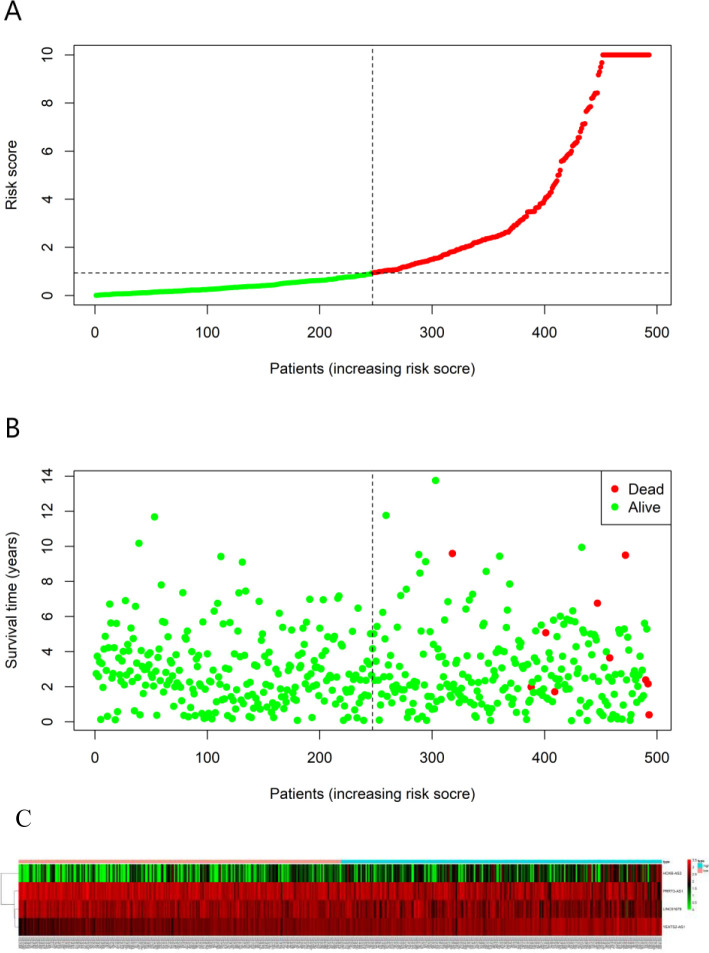
Fig 4. Ability of the 4 lncRNAs-based signature in predicting the prognosis for PCa cases from TCGA database.
(A) Risk score distribution for patients. (B) PCa patient survival time. (C) Expression heat map for those four lncRNAs incorporated into the prognosis model. The vertical black dotted line stands for the optimum threshold to divide cases to high- or low-risk group.

