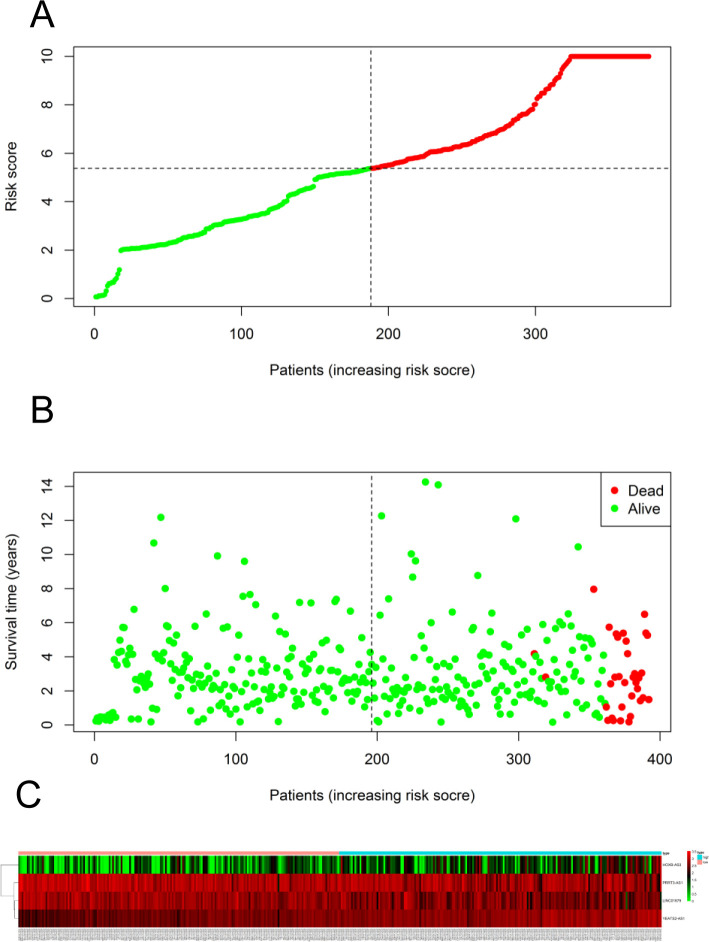
Fig 5. Predictive power of the model for prognosis in PCa patients.
(A) Distribution of patient risk score. (B) Survival time of PCa patients.(C) Heat maps of the four lncRNAs included in the prognostic model. The vertical dotted black line represents the optimal threshold for classifying cases into high—and low-risk groups.

