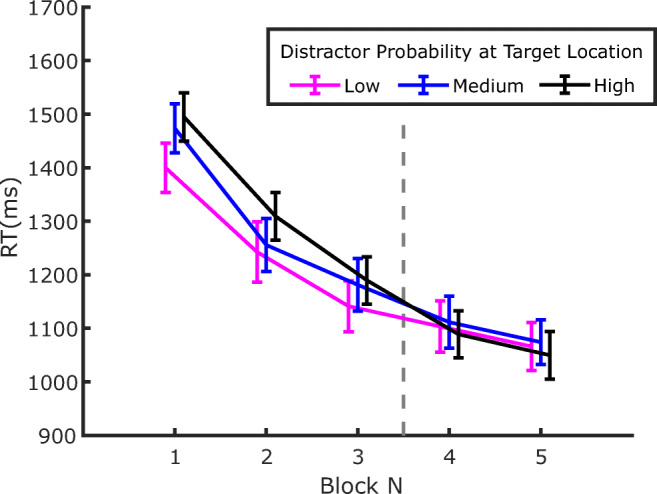
Fig. 8.

Evolution of RTs in distractor-absent trials plotted as a function of the target location. Notice that the pattern of results in the first three training blocks seems to be reversed relative to Fig. 6, indicating that reduced distraction at a given location implies reduced responsiveness to the target as well. The effect seems to dissipate immediately in the following test blocks. Error bars represent SEMs. The vertical dashed line marks the boundary between the training phase, where distractors were presented according to the probability associated with the location (Blocks 1–3), and the test phase where distractor probability became equal to the one of the low probability location in all three locations (Blocks 4–5)
