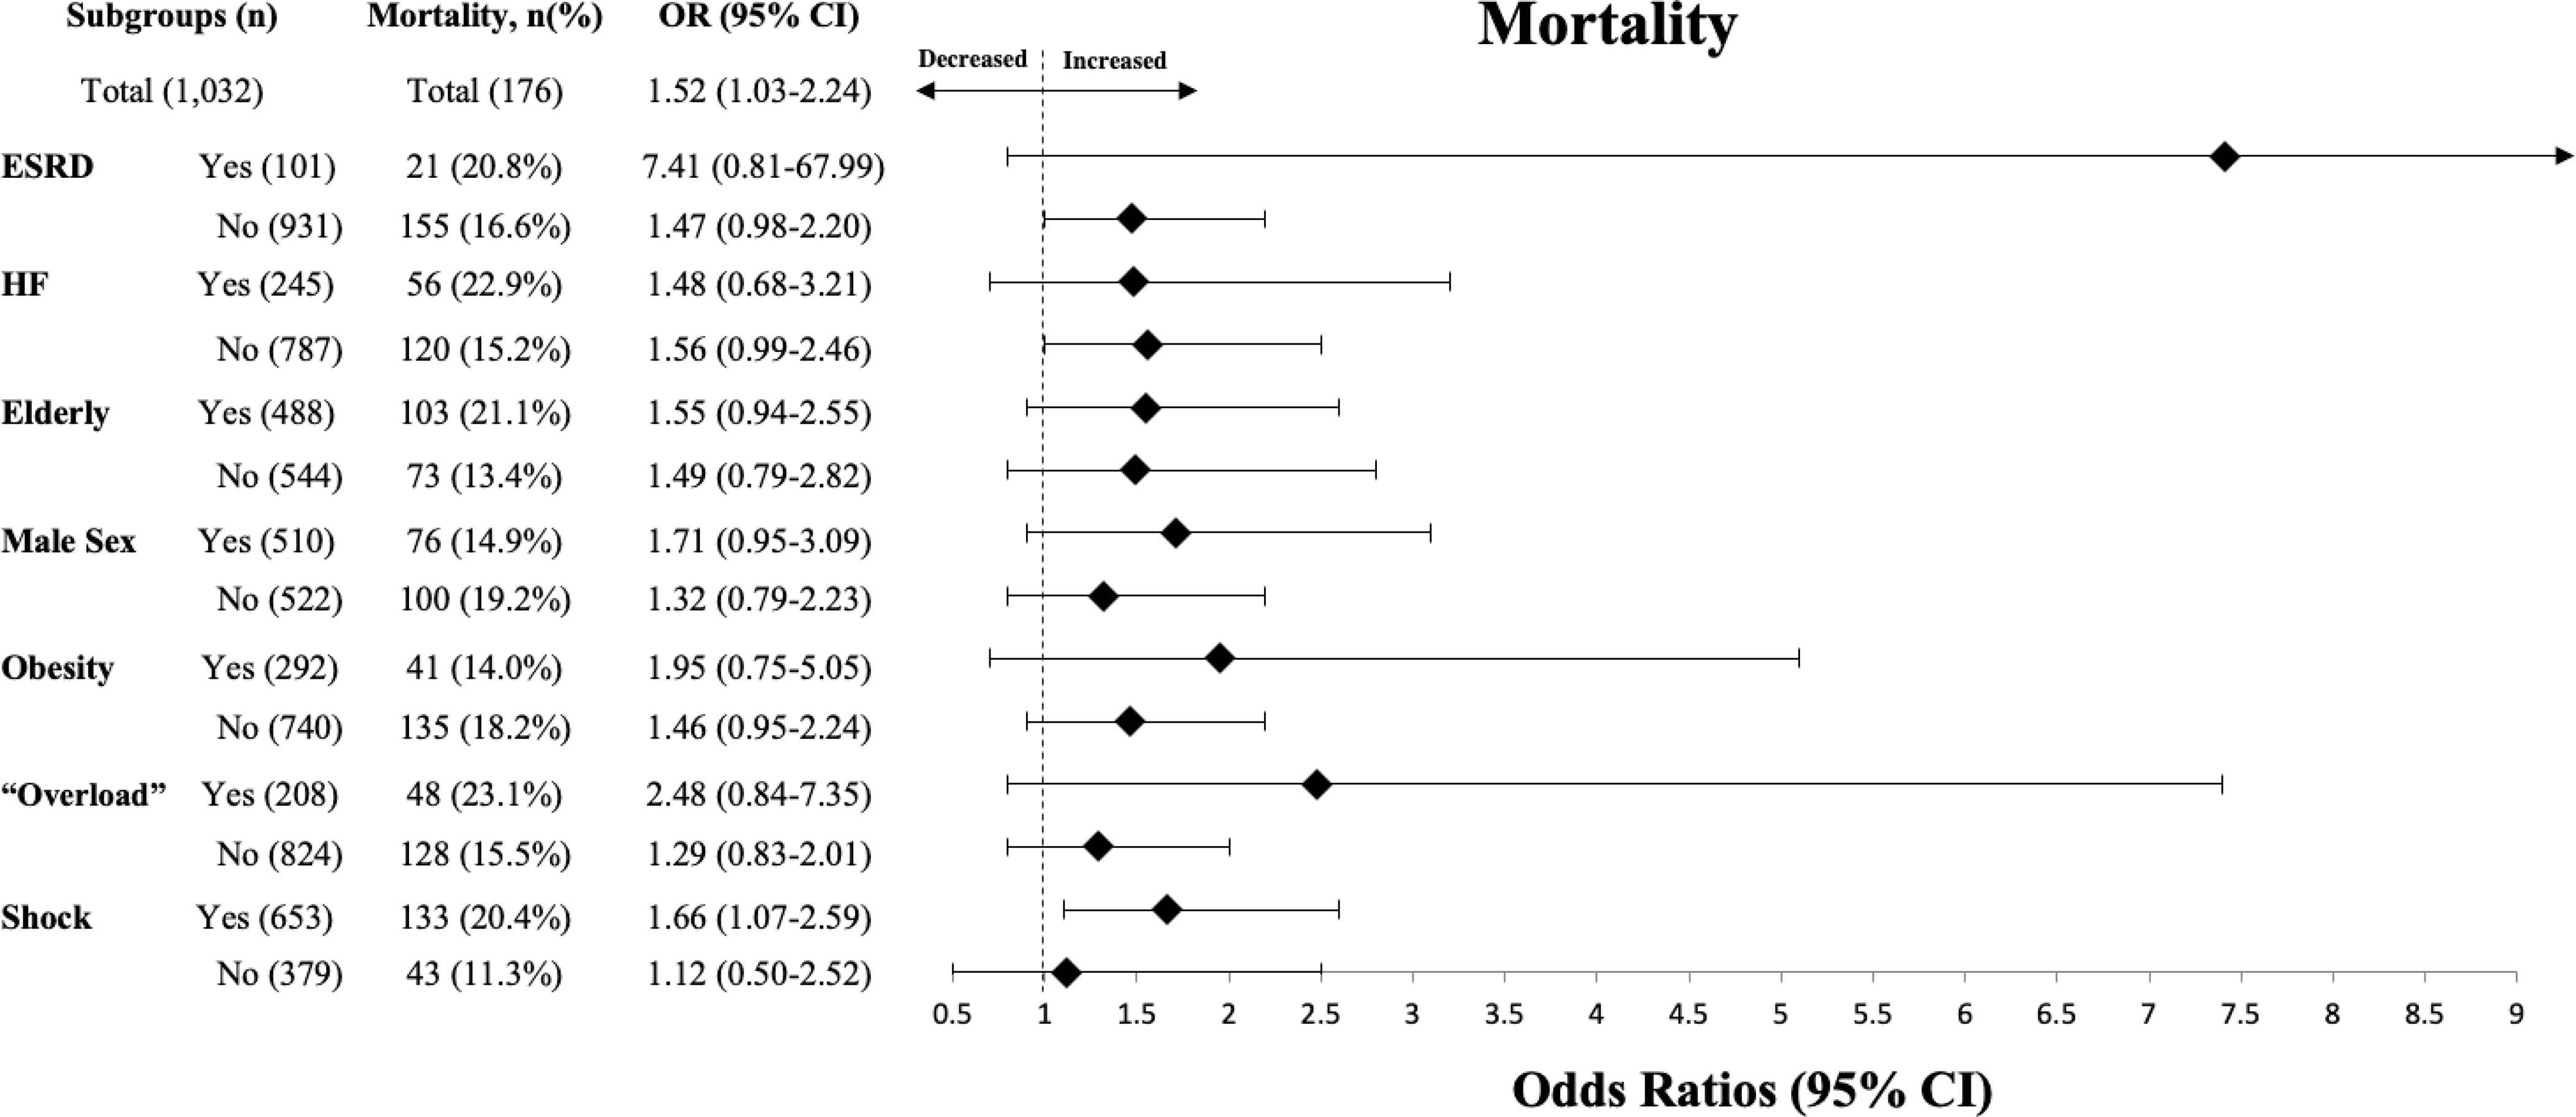
Figure 2. Comparison of the Effect of 30after3 on Mortality Across Subgroups.

Figure 2 demonstrates a subgroup analysis comparing the effects of 30after3 on mortality across various subgroups of patients. An odds ratio >1 indicating increased odds of mortality for those failing to meet fluid goals when compared to those meeting fluid goals. When evaluating specific subgroups, no significant interaction effects were found.
