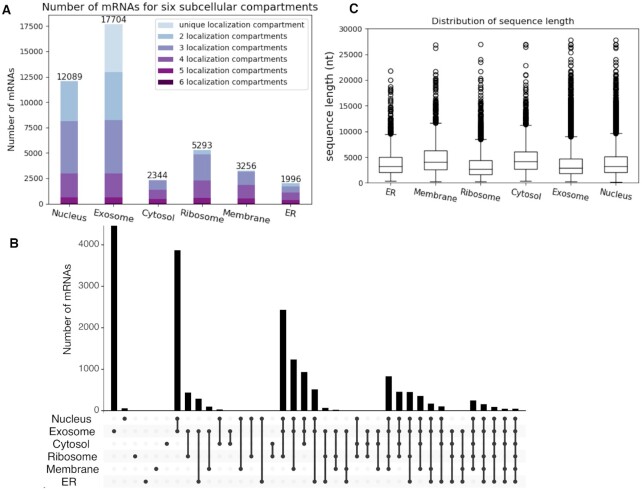
Figure 1.
Statistics of mRNA subcellular localization benchmark data. (A) shows the number of mRNAs for six subcellular compartments. Each bar represents one compartment and the height represents the number of samples. For each bar, from the bottom to the top represent the number of mRNAs with six localization annotations to the number of mRNAs with a unique localization label, respectively. The total number of mRNAs in each compartment in (A) is labeled on the top. (B) An upset plot, which shows the detailed number of mRNA sequences in each intersection group. The intersection group is presented in the order of the compartment numbers (from left to right). The upper bar plot presents the number of mRNAs in each intersection group, while the bottom dots show the components of each group. (C) The distribution of sequence length for six subcellular localization compartments.

