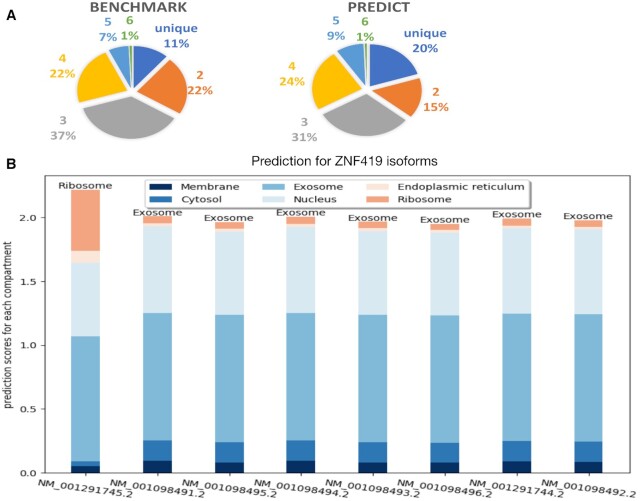
Figure 3.
Applying DM3Loc to predict localization for all the human mRNAs (genome GRCh38). (A) The mRNA subcellular localization label distribution in benchmark and prediction pie charts. The left pie chart shows the label distribution of mRNAs in the benchmark dataset. The right pie chart shows the predicted label distribution of mRNAs in the GRCh38 human reference genome. The label distributions include a unique subcellular localization label, two labels, …, and six labels. (B) Prediction for isoforms of gene ZNF419. Each bar represents the prediction scores for the six subcellular localizations of each isoform; the predicted labels whose scores were higher than the default threshold are labels are on the top. The prediction scores of all the other isoforms are similar, except for isoform NM_001291745, which is predicted to be localized in the ribosome.

