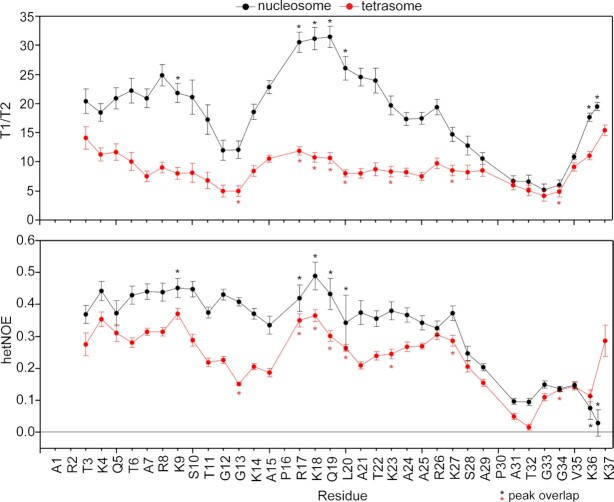
Figure 3.
H3 tail picosecond-nanosecond timescale dynamics are distinct between nucleosome and tetrasome. {1H}–15N hetNOE values and ratio of 15N relaxation times (T1/T2) are plotted as a function of H3 tail residue for 15N-H3 nucleosome (black) and tetrasome (red). Residues with peak overlap are marked by ‘*’.

