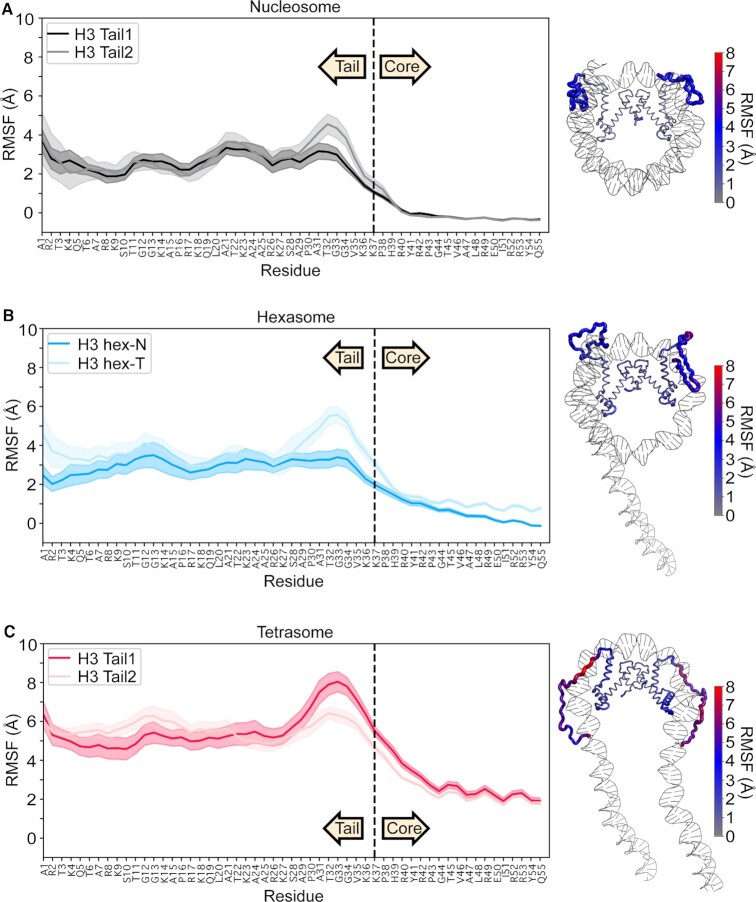
Figure 4.
Residue-wise root mean square fluctuation (RMSF) values obtained from the equilibrated portion of MD trajectories. Plots are for (A) nucleosome, (B) hexasome and (C) tetrasome with the average of 10 simulations plotted as a solid line and the standard error of the mean shaded. Data are plotted for the first 55 residues of H3, where residues 1–37 and 38–55 are defined as tail and the initial region of the core, respectively. RMSF values are also plotted on a representative end-state structure of each nucleosomal species. The thickness and color (see key) of the cartoon backbone represents the RMSF value for a given residue, where thicker indicates larger RMSF. H3 is the only histone displayed in the image for ease of visualization.

