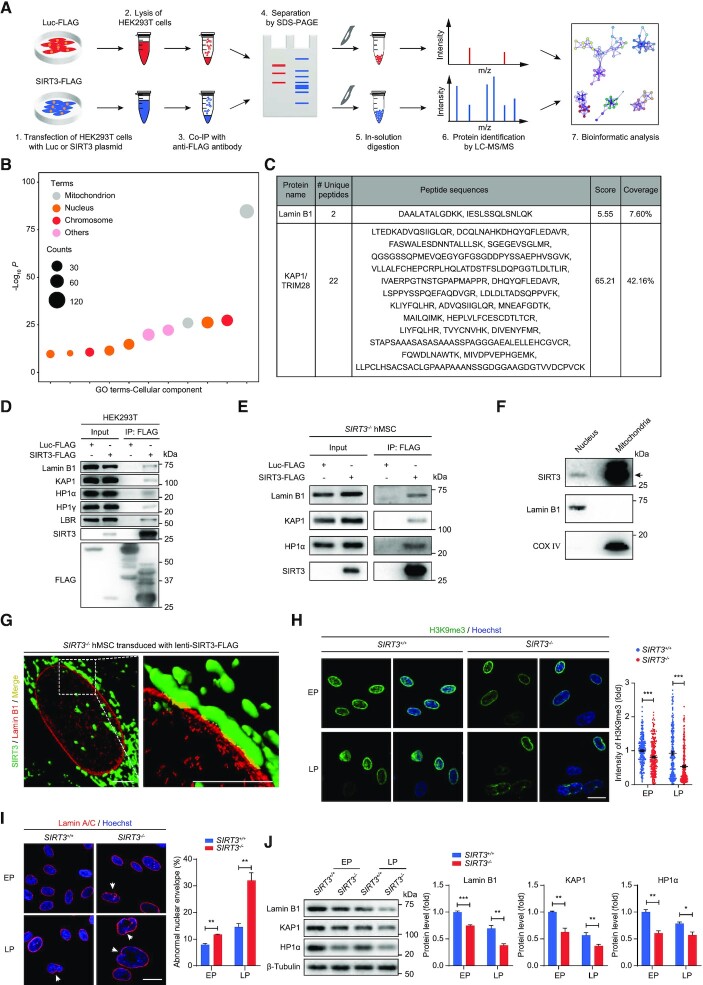
Figure 3.
SIRT3 interacts with nuclear lamina and heterochromatin-associated proteins. (A) Schematic workflow of co-IP followed by LC-MS/MS analysis for identifying SIRT3-interacting proteins. FLAG-tagged Luc was used as negative control. (B) Gene Ontology Cellular Component (GO-CC) enrichment analysis of SIRT3-interacting proteins identified by mass spectrometry. (C) Lamin B1 and KAP1 were identified as novel interacting proteins of SIRT3 by mass spectrometry. (D) Co-IP analysis for the interactions between indicated proteins and SIRT3-FLAG in HEK293T cells. (E) Co-IP analysis for the interactions of KAP1, Lamin B1, HP1α with SIRT3 in SIRT3–/–hMSCs. (F) Western blot analysis of SIRT3 in the fractions of nucleus and mitochondria isolated from SIRT3+/+hMSCs. The black arrow indicates the expected position of SIRT3. Lamin B1 and COX IV were used as marker proteins for nuclear and mitochondrial fractions, respectively. (G) Three-dimensional reconstruction images showing the colocalization of SIRT3 with Lamin B1 in SIRT3–/– hMSCs expressing FLAG-tagged SIRT3. SIRT3 (FLAG) is shown in green, Lamin B1 is marked in red and the colocalization of SIRT3 and Lamin B1 is shown in yellow. Scale bar, 4 μm. (H) Immunofluorescence analysis of H3K9me3 in SIRT3+/+and SIRT3–/– hMSCs at EP (P4) and LP (P9). Scale bar, 25 μm. Data are presented as the means ± SEM. n > 200. ***P < 0.001. (I) Immunofluorescence analysis of Lamin A/C in SIRT3+/+and SIRT3–/– hMSCs at EP (P4) and LP (P9). Scale bar, 25 μm. The white arrow indicates abnormal nuclear envelope. The statistical analysis of abnormal nuclear envelope is shown on the right. Data are presented as the means ± SEM. n = 3. **P < 0.01. (J) Western blot analysis of Lamin B1, KAP1 and HP1α in SIRT3+/+ and SIRT3–/– hMSCs at EP (P4) and LP (P9). β-Tubulin was used as loading control. Data are presented as the means ± SEM. n = 3. *P < 0.05; **P < 0.01; ***P < 0.001.

