Figure 4.
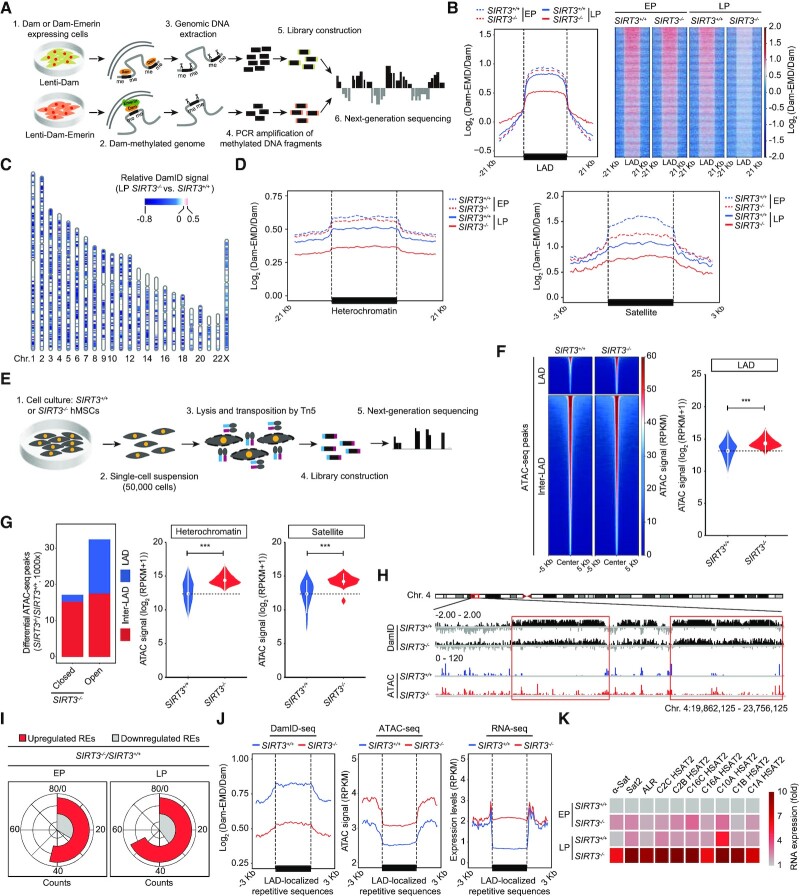
DamID-seq and ATAC-seq analyses in SIRT3+/+ and SIRT3–/– hMSCs. (A) Schematic diagram showing the workflow for DamID-seq library preparation and sequencing. Dam-Emerin expression in hMSCs drives the methylation of adenines near the nuclear envelope by the DNA adenine methyltransferase (Dam). Genomic DNA sequence containing Dam-methylated sites was specifically cut using Dpn I, PCR amplified, and then used for library construction and high-throughput sequencing. A parallel control ‘Dam only’ was used to account for background Dam signals. (B) Line plot (left) and heatmaps (right) showing reduced DamID signals [log2 (Dam-EMD/Dam)] at LAD regions in SIRT3–/– hMSCs compared to SIRT3+/+ hMSCs at EP (P4) and LP (P9). (C) Ideogram showing the loss of DamID signals in SIRT3–/– hMSCs compared to those in SIRT3+/+ hMSCs at LP (P9) over 23 chromosomes. The color key from blue to red represents relatively low to high DamID signals in SIRT3–/– hMSCs compared to those in SIRT3+/+ hMSCs. (D) Line plots showing the loss of DamID signals at heterochromatin regions and LAD-localized satellite repetitive elements in SIRT3–/– hMSCs compared to those in SIRT3+/+ hMSCs at EP (P4) and LP (P9). (E) Schematic diagram showing the workflow for ATAC-seq library preparation and sequencing. (F) Left, heatmaps showing the ATAC signals within LAD and inter-LAD regions in SIRT3+/+ hMSCs and SIRT3–/– hMSCs at LP (P9). Right, violin plot showing the ATAC signals within LADs in SIRT3+/+ hMSCs and SIRT3–/– hMSCs at LP (P9). ***P < 0.001. (G) Left, the distribution of differential ATAC-seq peaks within LAD or inter-LAD regions of SIRT3–/– hMSCs compared to those of SIRT3+/+ hMSCs at LP (P9). Right, violin plots showing increased accessibility at heterochromatin regions and LAD-localized satellite repetitive elements in SIRT3–/– hMSCs compared to those in SIRT3+/+ hMSCs at LP (P9). ***P < 0.001. (H) Representative tracks of DamID-seq and ATAC-seq signals showing decreased DamID signals along with increased ATAC-seq signals within LAD regions in SIRT3–/– hMSCs compared to those in SIRT3+/+ hMSCs at LP (P9). (I) RNA-seq analysis showing repetitive elements (REs) that were differentially expressed in SIRT3–/– hMSCs compared to those in SIRT3+/+ hMSCs at EP (P3) and LP (P7). (J) Line plots showing decreased DamID signals, increased chromatin accessibility and upregulated expression levels of LAD-localized repetitive sequences in SIRT3–/–hMSCs at LP (P7 for RNA-seq and P9 for DamID-seq and ATAC-seq) compared to SIRT3+/+ hMSCs using a conjoint analysis of DamID-seq, ATAC-seq and RNA-seq. LAD-localized repetitive sequences with higher expression levels in SIRT3–/– hMSCs at LP (P7) were processed for conjoint analysis. (K) Heatmap showing the relative RNA expression levels of repetitive elements in SIRT3–/–hMSCs compared to those in SIRT3+/+ hMSCs at EP (P4) and LP (P9) using RT-qPCR analysis. Expression levels of repetitive elements were normalized to SIRT3+/+ hMSCs at EP (P4). Data are representative of three independent experiments.

