Figure 5.
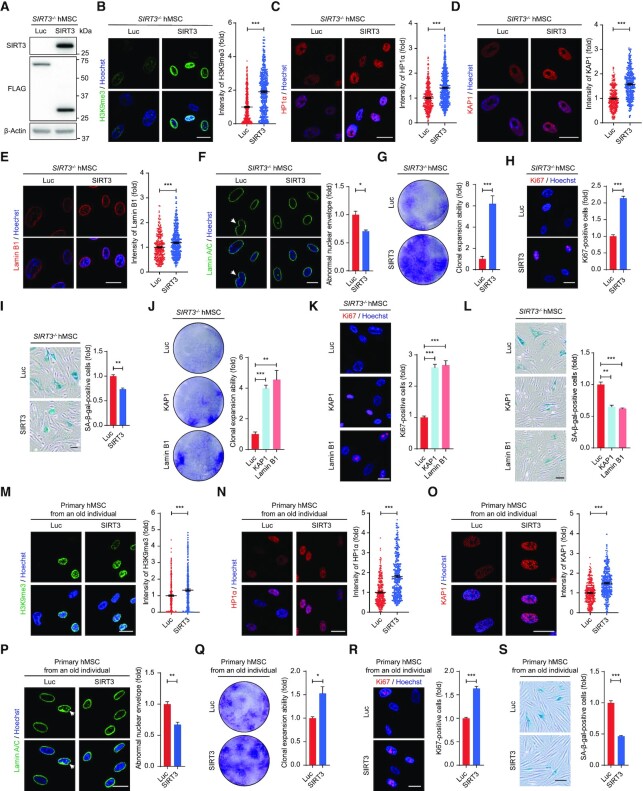
Overexpression of SIRT3 alleviates hMSC senescence. (A) Western blot analysis showing the levels of SIRT3 and FLAG-tagged proteins in SIRT3–/– hMSCs (P6) expressing Luc-FLAG or SIRT3-FLAG. β-Actin was used as loading control. (B) Immunofluorescence analysis of H3K9me3 in SIRT3–/– hMSCs (P6) expressing Luc or SIRT3. Scale bar, 25 μm. Data are presented as the means ± SEM. n > 300. ***P < 0.001. (C) Immunofluorescence analysis of HP1α in SIRT3–/– hMSCs (P6) expressing Luc or SIRT3. Scale bar, 25 μm. Data are presented as the means ± SEM. n > 300. ***P < 0.001. (D) Immunofluorescence analysis of KAP1 in SIRT3–/– hMSCs (P6) expressing Luc or SIRT3. Scale bar, 25 μm. Data are presented as the means ± SEM. n > 300. ***P < 0.001. (E) Immunofluorescence analysis of Lamin B1 in SIRT3–/– hMSCs (P6) expressing Luc or SIRT3. Scale bar, 25 μm. Data are presented as the means ± SEM. n > 300. ***P < 0.001. (F) Immunofluorescence analysis of Lamin A/C in SIRT3–/– hMSCs (P6) expressing Luc or SIRT3. Scale bar, 25 μm. The white arrow indicates abnormal nuclear envelope. The statistical analysis of abnormal nuclear envelope is shown on the right. Data are presented as the means ± SEM. n = 3. *P < 0.05. (G) Clonal expansion analysis of SIRT3–/– hMSCs (P6) expressing Luc or SIRT3. Data are presented as the means ± SEM. n = 3. ***P < 0.001. (H) Immunofluorescence analysis of Ki67 in SIRT3–/– hMSCs (P6) expressing Luc or SIRT3. Scale bar, 25 μm. The statistical analysis of Ki67-positive cells is shown on the right. Data are presented as the means ± SEM. n = 3. ***P < 0.001. (I) SA-β-gal staining of SIRT3–/– hMSCs (P6) expressing Luc or SIRT3. Scale bar, 50 μm. Data are presented as the means ± SEM. n = 3. **P < 0.01. (J) Clonal expansion analysis of SIRT3–/– hMSCs (P6) expressing Luc, KAP1 or Lamin B1. Data are presented as the means ± SEM. n = 3. **P < 0.01; ***P < 0.001. (K) Immunofluorescence analysis of Ki67 in SIRT3–/– hMSCs (P6) expressing Luc, KAP1 or Lamin B1. Scale bar, 25 μm. The statistical analysis of Ki67-positive cells is shown on the right. Data are presented as the means ± SEM. n = 3. ***P < 0.001. (L) SA-β-gal staining of SIRT3–/– hMSCs (P6) expressing Luc, KAP1 or Lamin B1. Scale bar, 50 μm. Data are presented as the means ± SEM. n = 3. **P < 0.01; ***P < 0.001. (M) Immunofluorescence analysis of H3K9me3 in primary hMSCs (P10) expressing Luc or SIRT3. Scale bar, 25 μm. Data are presented as the means ± SEM. n > 300. ***P < 0.001. (N) Immunofluorescence analysis of HP1α in primary hMSCs (P10) expressing Luc or SIRT3. Scale bar, 25 μm. Data are presented as the means ± SEM. n > 300. ***P < 0.001. (O) Immunofluorescence analysis of KAP1 in primary hMSCs (P10) expressing Luc or SIRT3. Scale bar, 25 μm. Data are presented as the means ± SEM. n > 300. ***P < 0.001. (P) Immunofluorescence analysis of Lamin A/C in primary hMSCs (P10) expressing Luc or SIRT3. Scale bar, 25 μm. The white arrow indicates abnormal nuclear envelope. The statistical analysis of abnormal nuclear envelope is shown on the right. Data are presented as the means ± SEM. n = 3. **P < 0.01. (Q) Clonal expansion analysis of primary hMSCs (P10) expressing Luc or SIRT3. Data are presented as the means ± SEM. n = 3. *P < 0.05. (R) Immunofluorescence analysis of Ki67 in primary hMSCs (P10) expressing Luc or SIRT3. Scale bar, 25 μm. The statistical analysis of Ki67-positive cells is shown on the right. Data are presented as the means ± SEM. n = 3. ***P < 0.001. (S) SA-β-gal staining of primary hMSCs (P10) expressing Luc or SIRT3. Scale bar, 50 μm. Data are presented as the means ± SEM. n = 3. ***P < 0.001.

