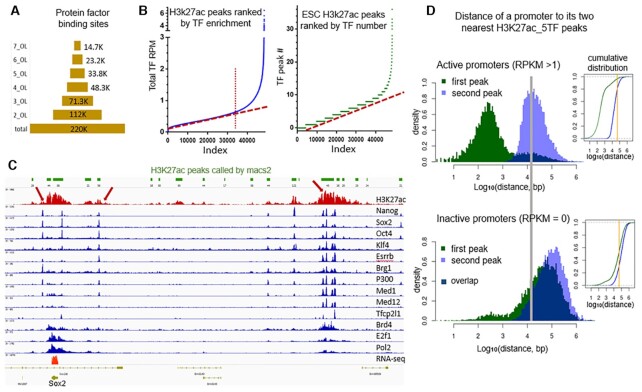
Figure 1.
Enrichment of TFs at a small number of regulatory sites and active genes are associated with nearby enhancers. (A) Number of genomic sites that have different levels of TF enrichment (OL: overlapping). (B) H3K27ac peaks ranked by TF-peak enrichment; left: by total overlapping TF-signal intensity; right: by total number of overlapping TFs. (C) An example of enhancers associated with the only highly expressed gene nearby and TF-enrichment as reflecting enhancer strength. (D) Left: Histogram of the nearest (green) and the second nearest (purple) H3K27ac_5TF to the TSS of active genes (RPKM>1) and inactive genes (RPKM = 0) in mouse ESC. Dark blue area marks the overlapping part of the two peaks. Right: Cumulative distribution plot of the same data, green the nearest and blue the second nearest H3K27ac_5TF. The orange line marks a distance of 50 kb.

