Figure 5.
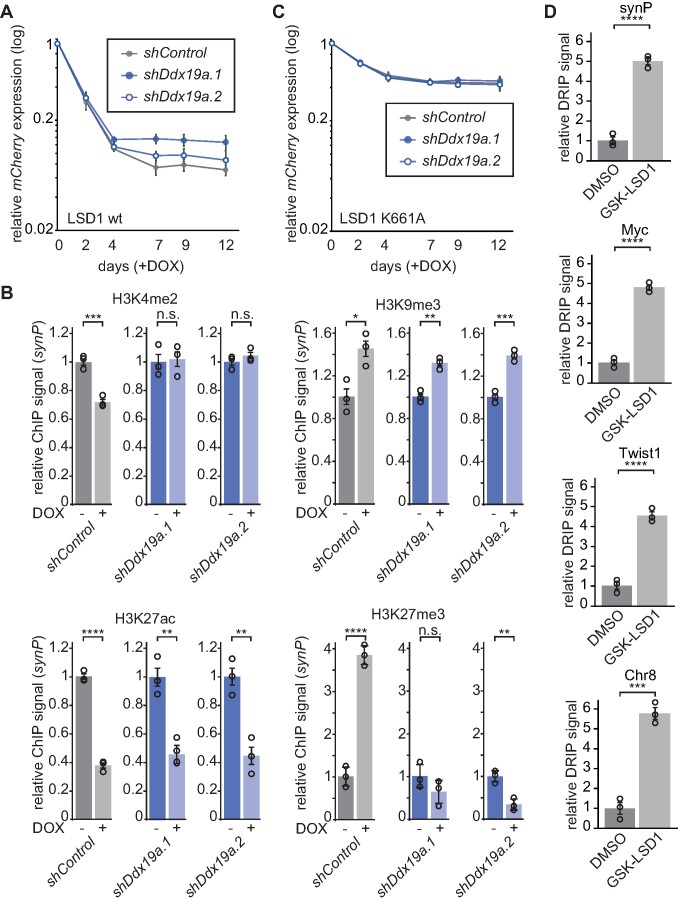
LSD1 and DDX19A act in concert to regulate transcription. (A) Time course of the mCherry expression in NIH/3T3 expressing the synP-mCherry reporter, the rTetR-LSD1 fusion protein and the indicated shRNAs under DOX treatment. Circles indicate the median mCherry expression measured by flow cytometry relative to the initial measurement (n = 3; mean ± s.e.m.). (B) ChIP-qPCR analysis of the indicated histone modifications at the synP element in cells expressing the LSD1 reporter system and the indicated shRNAs. IPs were performed with mononucleosomes isolated from NIH/3T3 reporter cell lines after 4 days (H3K4me2, H3K27ac) or 14 days (H3K9me3) of LSD1 recruitment. Bars are relative to -DOX (n = 3; mean ± s.e.m.; *P ≤ 0.05, **P ≤ 0.01, ***P ≤ 0.001, ****P ≤ 0.0001, n.s. = non-significant; Student's t-test). (C) Time course of the mCherry expression in NIH/3T3 cells expressing the synP-mCherry reporter, the rTetR-K661A fusion protein and the indicated shRNAs under treatment with DOX. Circles indicate the median mCherry expression measured by flow cytometry relative to day 0 (n = 3; mean ± s.e.m.). (D) DRIP-qPCR analysis of RNA:DNA hybrid structures at selected endogenous loci under treatment with GSK-LSD1. Total nucleic acids were extracted from NIH/3T3 cells transduced with the synP-mCherry reporter after 3 days of treatment with 50 μM GSK-LSD1 or DMSO and used as input for the IP with the S9.6 antibody. qPCR signals are shown relative to DMSO. Circles represent independent replicates (n = 3, mean ± s.e.m.; ***P ≤ 0.001, ****P ≤ 0.0001, Student's t-test).

