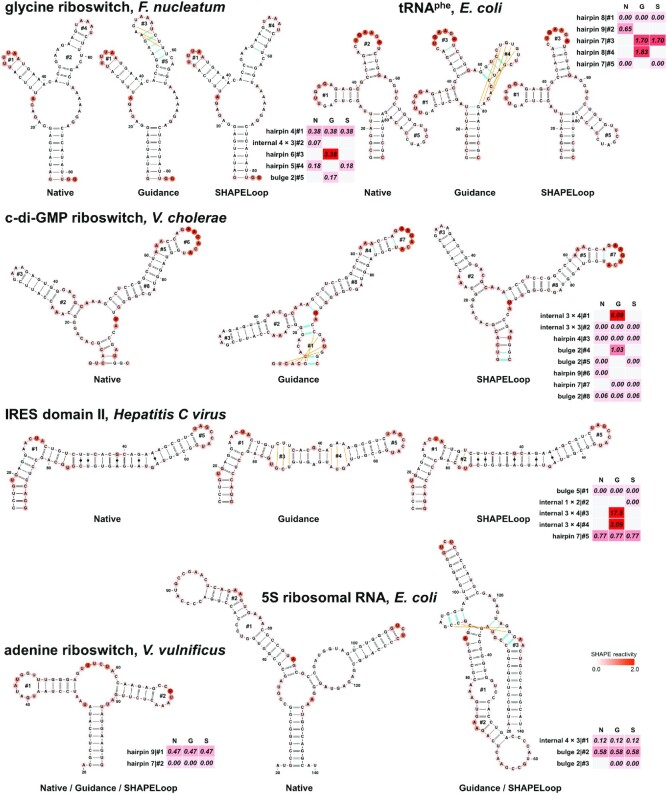
Figure 3.
SHAPELoop efficiently identifies loops that are falsely predicted by RNAstructure and selects candidates with low penalties. Shown are the native structures (N), RNAstructure-predicted guidance structures (G), and SHAPELoop-predicted structures (S) for six benchmark RNAs. The SHAPE reactivities are shown on the structures using a coloring scheme. The penalties are shown as heat maps. The false-positive (incorrect) base pairs in the guidance or SHAPELoop-predicted structures are shown by green lines, and false-negative (missing) base pairs are shown by orange lines. The remaining benchmark RNAs are shown in Supplementary Figures S7 and S8.

