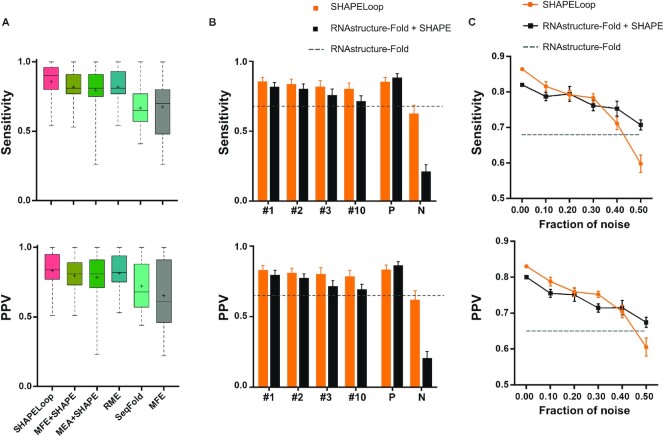
Figure 4.
Performance comparison between SHAPELoop and other algorithms. (A) Boxplot comparison of the performances of SHAPELoop and five other predictors on benchmark RNAs. The central marks indicate the medians, and the bottom and top edges of the boxes indicate the 25th and 75th percentiles, respectively. The mean values are shown as ‘+’. (B) Comparison of the performances of SHAPELoop using different guidance structures on benchmark RNAs. The guidance structures are replaced by structures of different energy rankings: ‘#1’, ‘#2’, ‘#3’, and ‘#10’ refer to the structure with the first (MFE), second, third, and tenth lowest energy, respectively. ‘P’ (i.e. positive) indicates the RNAstructure-predicted candidates with the highest Matthews correlation coefficient (MCC), and ‘N’ (i.e. negative) indicates the RNAstructure-predicted candidates with the lowest MCC. (C) The sensitivity and positive predictive value (PPV) yielded by SHAPELoop and RNAstructure-Fold, with increasing fractions of SHAPE data replaced by randomized values. Error bars in (B) and (C) represent the standard errors of the means.

