Figure 2.
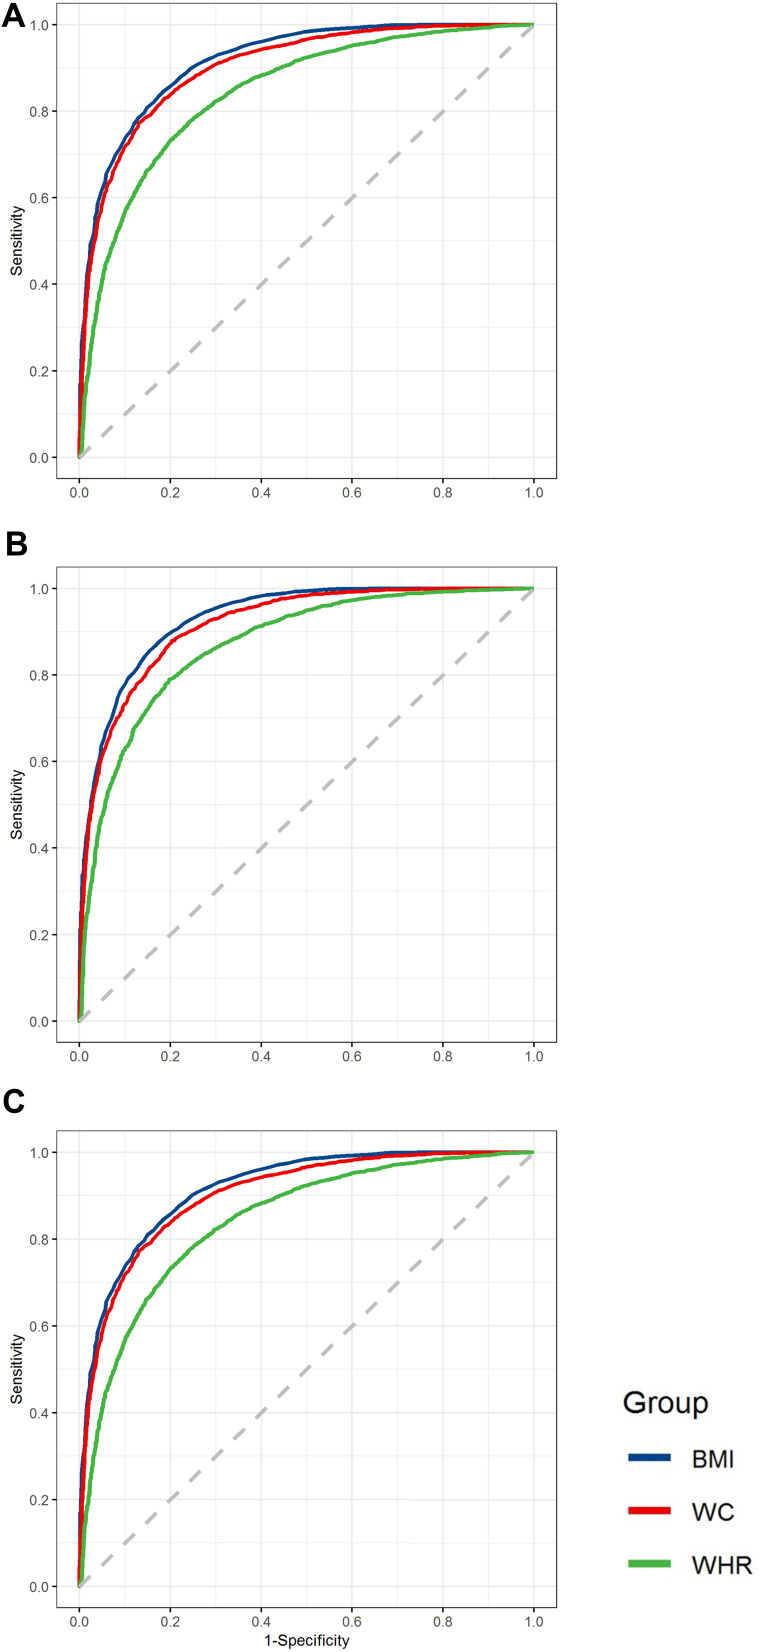
ROC curves for total participants (A), male (B) and female (C) in predicting sarcopenic obesity according to BMI, WC, WHR (GraphPad Prism 8 used to create the artwork).
Notes: ROC curves for total participants (A) in predicting sarcopenic obesity according to BMI, WC, WHR; ROC curves for males (B) in predicting sarcopenic obesity according to BMI, WC, WHR; ROC curves for females (C) in predicting sarcopenic obesity according to BMI, WC, WHR (GraphPad Prism 8 used to create the artwork).

