. 2021 Mar 9;10:e62585. doi: 10.7554/eLife.62585

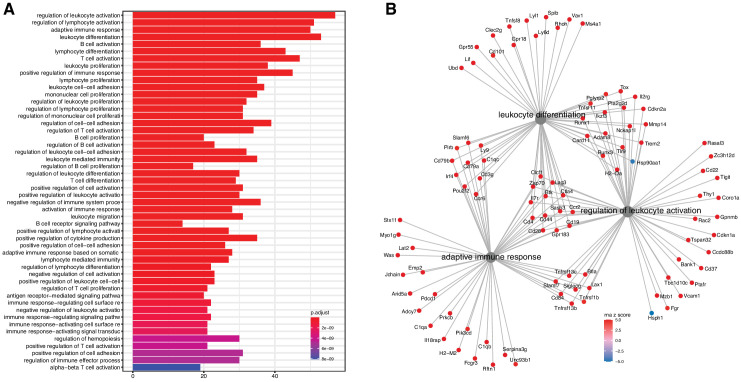
Figure 2. Analysis of differentially expressed mRNA with age.

(A) Functional enrichment and (B) network analysis, using ClusterProfiler, show overrepresentation of genes involved in immune and inflammatory response and is likely the result of immune cell infiltration into the kidney.

Figure 2.

Figure 2—figure supplement 1. Relative changes in kidney cell composition as a function of age.
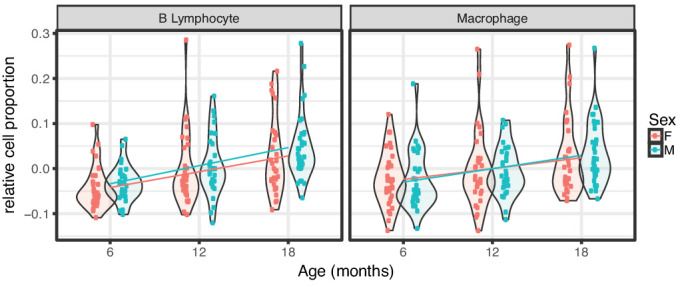
Figure 2—figure supplement 1.

Plots show relative cell proportions in kidneys for B lymphocyte and macrophage subsets as depicted in facets. Each point represents a cell proportion inferred for an individual mouse, and violin plots illustrate the density of points along the vertical axis. Lines depict linear regressions fit separately by sex. All elements of the plot are colored according to sex as illustrated in legend at right. Relative cell proportions were inferred from bulk RNA-Seq data using the CellCODE R package as detailed in Materials and methods.
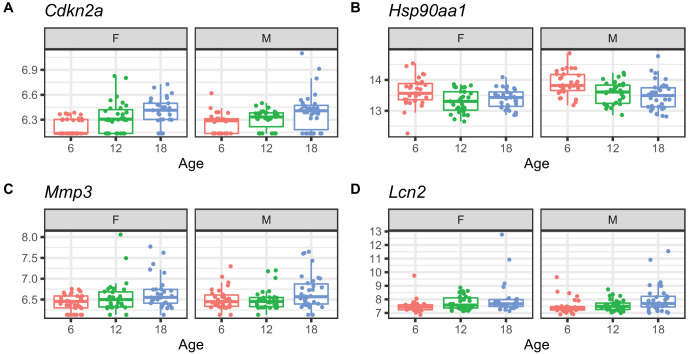
Figure 2—figure supplement 2. Examples of differential mRNA expression with age.

Figure 2—figure supplement 2.

(A) Increased expression of Cdkn2a, which encodes the senescence marker p16, (B) decreased expression of Hsp90aa1, a heat shock protein, (C) increased expression of Mmp3, a marker of cellular senescence, and (D) increased expression of Lcn2, a marker of proximal tubule damage.