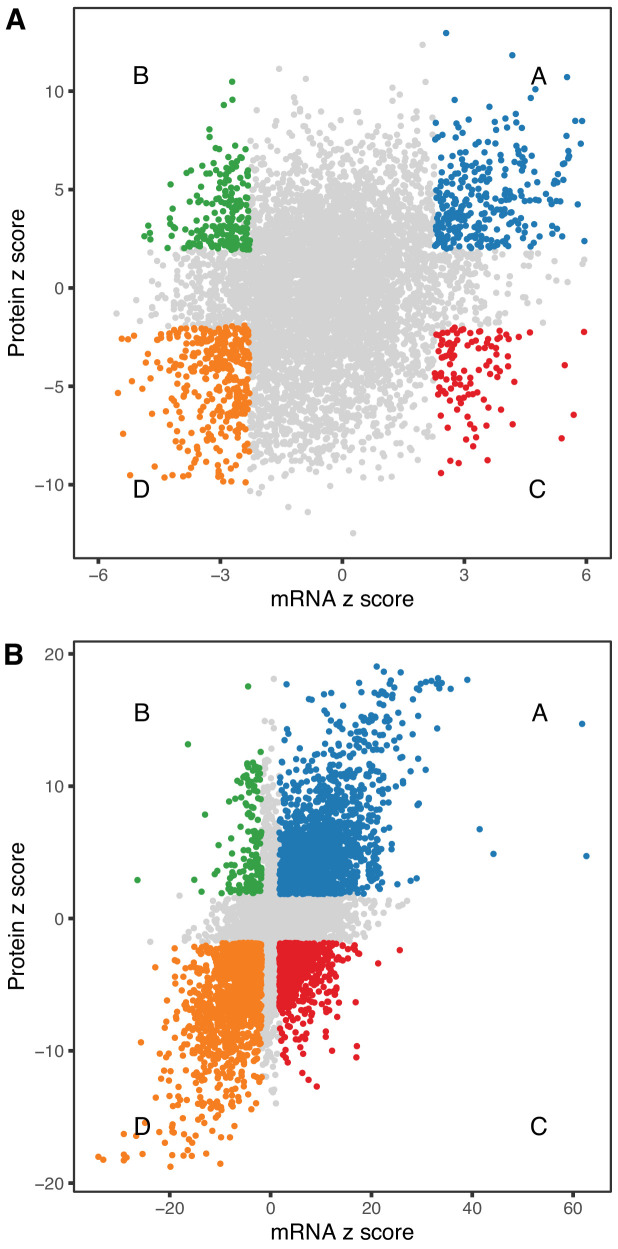
Figure 5. Comparison of age-related changes in mRNA and protein.
We identified 6514 genes with both mRNA and protein data of which 972 had significant differences with age (A) for both mRNA and protein. These can be divided in four groups depending on the direction of change, with decreased RNA and increased protein (green), decreased RNA and decreased protein (orange), increased RNA and increased protein (blue), and increased RNA and decreased protein (red). There is a similar pattern for sex-specific differences, although these are much more likely to be concordant (B). Each point represents a gene with significantly decreased RNA and increased protein (green), decreased RNA and decreased protein (orange), increased RNA and increased protein (blue), and increased RNA and decreased protein (red).

