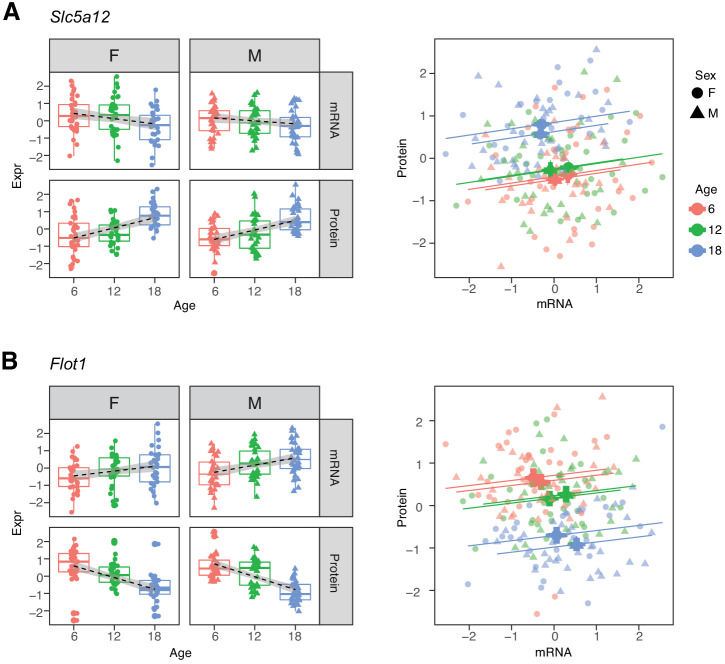
Figure 6. Examples of genes with opposite directions of age-related changes between mRNA and protein.
(A) Slc5a12 shows a decrease in mRNA and an increase in protein with age. Within age groups there is a positive correlation between mRNA and protein expression, but comparison between time points. (B) Flot1 shows the opposite with increased mRNA and decreased protein with age. Females (dots) and males (triangles) at 6 (red), 12 (green), and 18 months (blue) of age.

