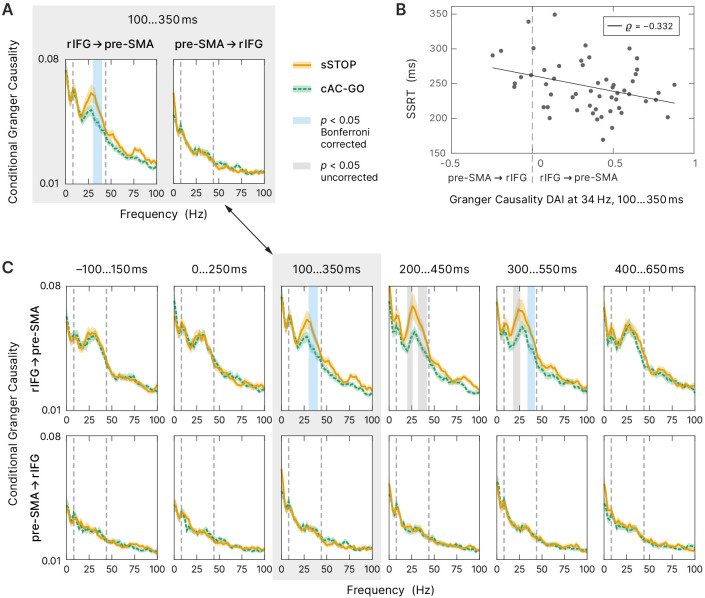
Figure 5. Connectivity analysis.
(A) Spectral-resolved conditional Granger causality (cGC) between right inferior frontal gyrus (rIFG) and pre-supplementary motor area (pre-SMA). Orange curve (solid line): cGC for successful stop (sSTOP) trials, green curve (dashed line): cGC for correct attentional capture go (cAC-GO) trials, bounded lines: standard error of the mean. A cluster-based permutation test was used to identify significant differences between both conditions. Significant differences (p<0.05) are highlighted in blue if Bonferroni corrected, that is, the two links tested, and in gray if uncorrected. The frequency range tested (8–44 Hz) is indicated by vertical dashed lines. n = 58 for the link rIFG to pre-SMA, n = 57 for pre-SMA to rIFG (subjects with average cGC below bias level in both conditions were excluded). (B) Stop-signal reaction time (SSRT) correlated with directed influence asymmetry index (DAI) for rIFG and pre-SMA cGC values (sSTOP trials, cGC at 34 Hz in the temporal region of interest [tROI], 100–350 ms). Positive DAI corresponds to links from rIFG to pre-SMA, while negative DAI corresponds to links from pre-SMA to rIFG. The negative correlation indicates that participants with higher cGC from rIFG to pre-SMA are the better inhibitors (faster SSRT). n = 55 with average cGC reliably above bias level (note that only sSTOP trials has been used here). (C) Temporal evolution of spectral-resolved cGC was analyzed post hoc between rIFG to pre-SMA (top) and pre-SMA to rIFG (bottom). A sliding window was shifted with 100 ms steps around the tROI. cGC from rIFG to pre-SMA (but not in the opposite direction) was significantly higher for sSTOP compared to cAC-GO trials in the tROI itself and in a later time window tested. Here, we corrected for testing six time windows and for testing in two directions (rIFG to pre-SMA and vice versa). Same formatting as in (A). Spectra of the tROI, highlighted with a gray-colored box, are also shown in (A).

