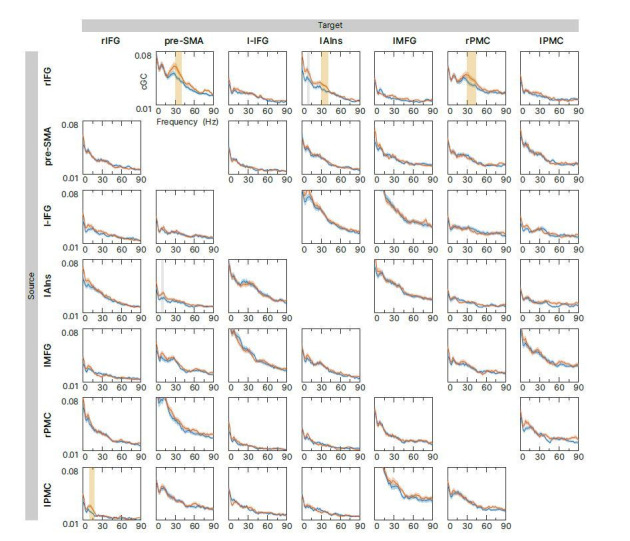
Author response image 1. Exploratory connectivity analysis during the tROI.

Spectral-resolved conditional Granger causality (cGC) between all source target pairs (links) was analyzed. Blue curve: cGC for sSTOP trials, green curve: cGC for cAC-GO trials, bounded lines: standard error of the mean. There were no significant differences between both conditions in the frequency range of 8-44Hz when correcting for all 42 links. However, significant differences were found if correction for multiple comparisons was reduced to six links (highlighted in yellow). Uncorrected significance is highlighted in grey.
