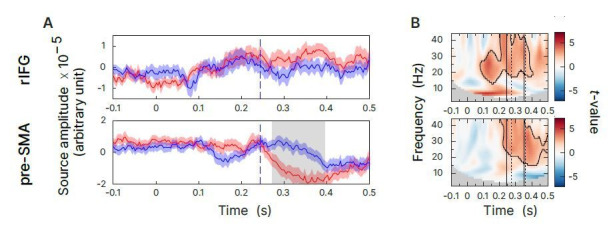
Author response image 4. Additional analysis of evoked responses and very low frequency oscillations.

(A) Statistical comparison of evoked responses, sSTOP red curve, cAC-GO blue curve. A cluster-based permutation test was performed between 0 and 500 ms. Significant difference are highlighted by grey boxes. (B) Oscillator analysis including very low frequencies (2-44Hz). Here, the contrast of z-transformed sSTOP versus cCA-GO trials is show (Cluster-based permutations test, two-tailed, αcluster = 0.5, n=59, significant clusters are outlined).
