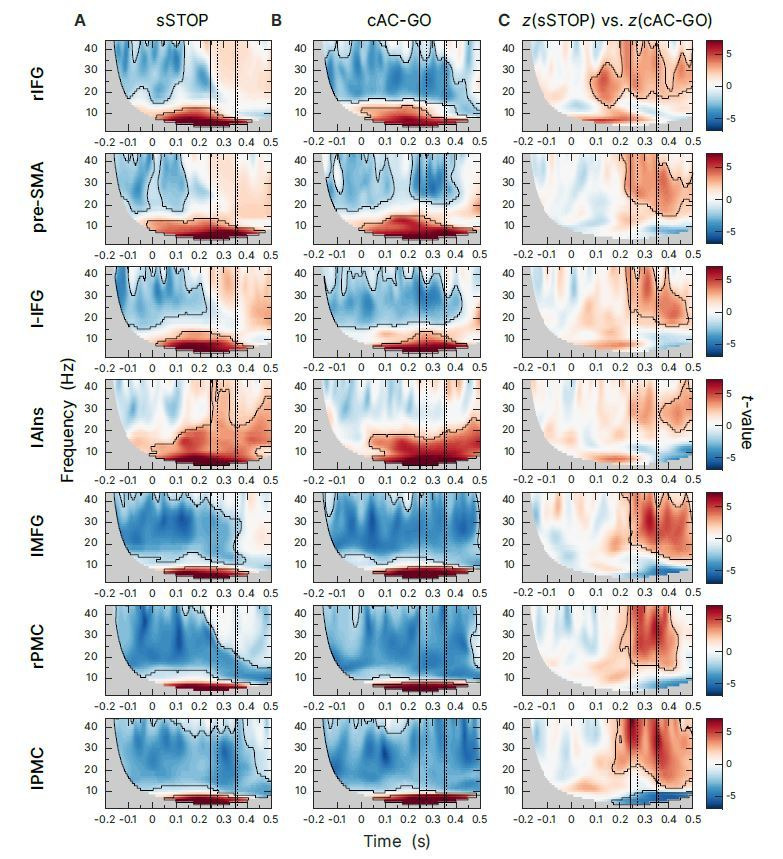
Author response image 6. Β-band time-frequency representations of virtual channels at sources identified.

First and second solid line indicate SSRT and SSRTmax, first and second dotted line indicate 10% and 50%-percentiles of RTAC-GO for selected AC-GO trials with RTAC-GO > SSRT (RT AC-GO is the duration between AC-GO signal and button, see Figure 1 of the manuscript). Time axis locked to STOP and AC-GO signal (0s). All plots shows the results of a cluster-based permutation test, two-tailed, αcluster = 0.05, n=59, significant cluster are outlined. (A) Task-versus-baseline power for successful stop (sSTOP) trials. (B) Task-versus-baseline power for correct attentional capture go (cAC-GO trials). (C) Contrast of z-transformed successful stop (sSTOP) versus correct attentional capture go (cAC-GO) trials.
