. 2021 May 4;10:e65088. doi: 10.7554/eLife.65088

Figure 1. bioBakery 3 includes new microbial community profiling approaches that outperform previous versions and current methods.

(A) The newly developed ChocoPhlAn 3 consolidates, quality controls, and annotates isolate-derived reference sequences to enable metagenomic profiling in subsequent bioBakery methods. (*The 1.1M MetaPhlAn 3 markers also encompass 61.8 k viral markers from MetaPhlAn 2 Truong et al., 2015) (B) MetaPhlAn 3 was applied to a set of 113 total evaluation datasets provided by CAMI (Fritz et al., 2019) representing diverse human-associated microbiomes and five datasets of non-human-associated microbiomes (Supplementary file 1). MetaPhlAn 3 showed increased performance compared with the previous version MetaPhlAn 2 (Truong et al., 2015), mOTUs2 (Milanese et al., 2019), and Bracken 2.5 (Lu et al., 2017). We report here the F1 scores (harmonic mean of the species-level precision and recall, see Figure 1—figure supplement 1 for other evaluation scores). (C) MetaPhlAn 3 better recapitulates relative abundance profiles both from human and murine gastrointestinal metagenomes as well from non-human-associated communities compared to the other currently available tools (full results in Figure 1—figure supplement 1). Bracken is reported both using its original estimates based on the fraction of reads assigned to each taxon and after re-normalizing them using the genome lengths of the taxa in the gold standard to match the taxa abundance estimate of the other tools. (D) Compared with HUMAnN 2 (Franzosa et al., 2018) and Carnelian (Nazeen et al., 2020), HUMAnN 3 produces more accurate estimates of EC abundances and displays a higher species true positive rate compared to HUMAnN 2. In panels B–D, an asterisk ('*') indicates that the bioBakery 3 method (MetaPhlAn 3 or HUMAnN 3) scored significantly better than all other methods (repeated paired t-tests over synthetic metagenomes, two-tailed p<0.05).

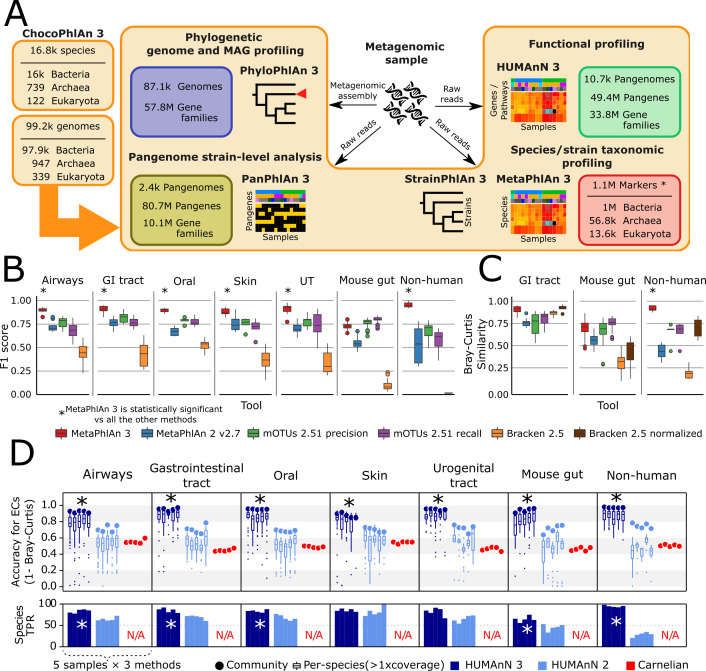
Figure 1.

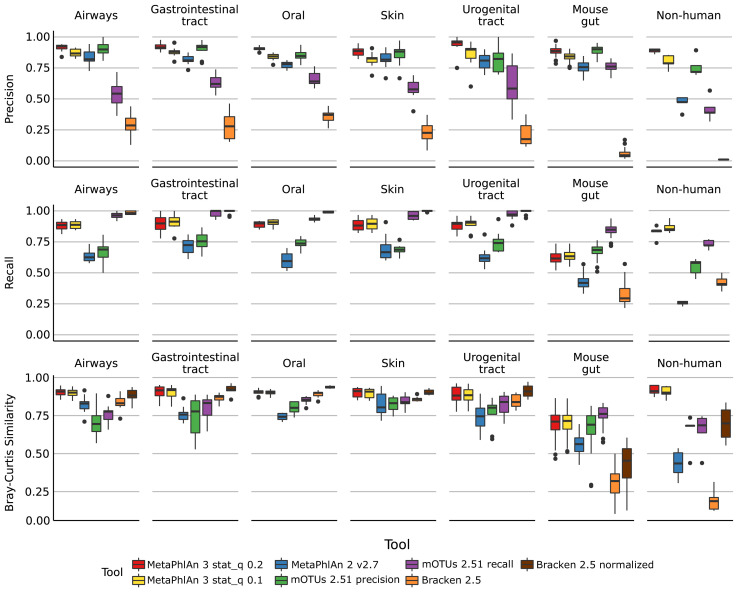
Figure 1—figure supplement 1. Performance metrics (Precision, Recall, Bray-Curtis similarity) of MetaPhlAn 3, MetaPhlAn2, mOTU, and Bracken species-level profiling of the CAMI human-associated, CAMI mouse gut, and non-human datasets.

Figure 1—figure supplement 1.

Bray-Curtis similarity index is calculated on arcsine-square-root transformed relative abundances.
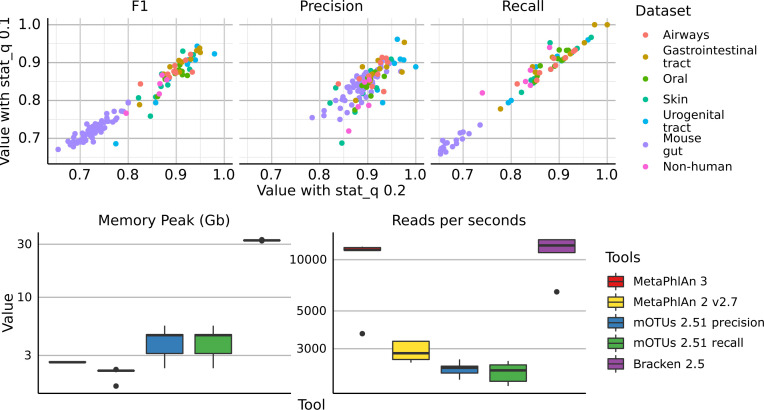
Figure 1—figure supplement 2. (top) Scatter plots of precision, recall, and F1 score, of all the synthetic metagenomes profiled with MetaPhlAn 3 using stat_q = 0.2 (default value for MetaPhlAn 3) and stat_q = 0.1 (rho = 0.97).

Figure 1—figure supplement 2.

(bottom) Comparison of memory usage (maxRSS) and speed of taxonomic profilers included in the evaluation. Each tool was run on 5 HMP metagenomes using one thread.
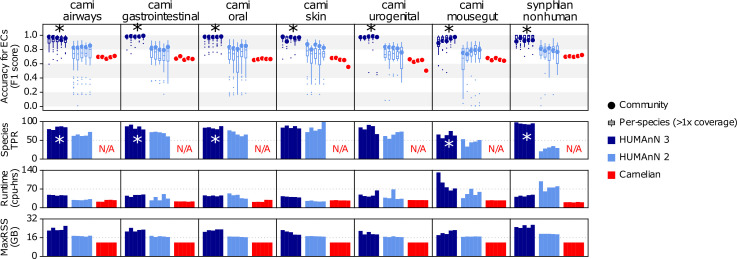
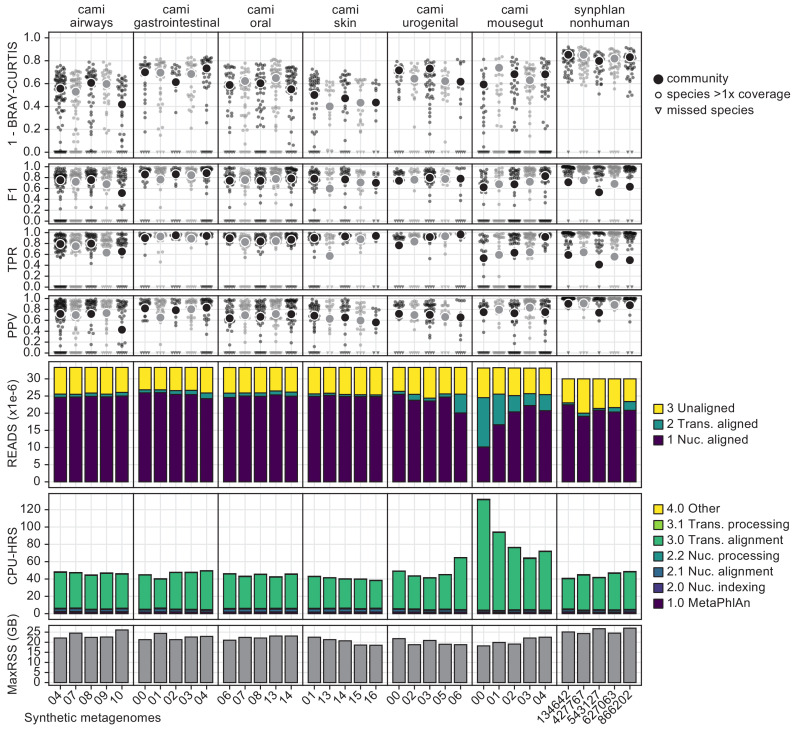
Figure 1—figure supplement 3. This figure expands Figure 1D from the main text to further compare HUMAnN 3, HUMAnN 2, and Carnelian on the basis of F1 score for accuracy of enzyme commission (EC) family detection, runtime (cpu-hrs), and peak memory usage (MaxRSS).

Figure 1—figure supplement 3.

'*' values indicate that HUMAnN 3’s F1 and species TPR scores were significantly higher than those of the other methods (between-method paired t-tests, all p-values<0.05).
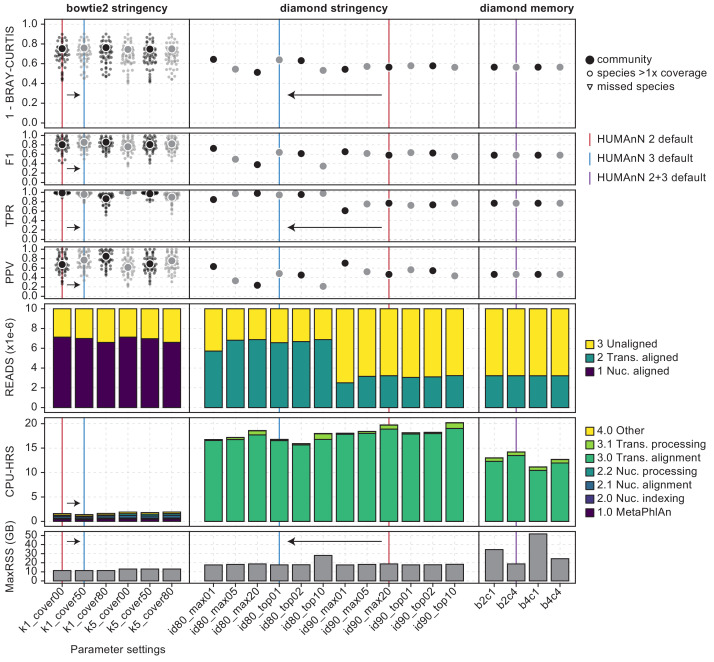
Figure 1—figure supplement 4. Re-optimization of HUMAnN 3 based on the synphlan-humanoid metagenome and UniRef90 gold standard.

Figure 1—figure supplement 4.

HUMAnN’s accuracy and performance using v2 settings on v3 databases are highlighted with red vertical lines; changes in v3 are highlighted with blue lines. Bowtie two settings were evaluated in ‘--bypass-translated-search’ mode and DIAMOND settings were evaluated in ‘--bypass-nucleotide-search’ mode. Left column: We compared accuracy and performance requesting 1 vs. 5 hits from Bowtie two and performing post hoc filtering of target sequences requiring 0% (i.e. no filtering), 50%, and 80% of sites to be hit. HUMAnN 3 adopts the 50% coverage filter while continuing to request a single hit per read. Center column: We compared a variety of DIAMOND stringency filters during translated search. HUMAnN 3 adopts a relaxed percent identity threshold per hit compared with v2 (80 vs. 90%) but considers fewer suboptimal hits (those within 1% bit score vs. the top 20). Right column: We evaluated different memory utilization settings in DIAMOND, but maintained the DIAMOND defaults (‘-b 2 c 4’) between v2 and v3.
Figure 1—figure supplement 5. This figure provides a high-resolution view of HUMAnN 3’s performance in the evaluations of main-text Figure 1D (accuracy and performance on CAMI and non-human-associated metagenomes).

Figure 1—figure supplement 5.

The top four rows (1 - BC, F1, TPR, and PPV) detail measures of accuracy for UniRef90-level protein families at the community (large dot) and well-covered-species (small dots) levels. The ‘READS’ row indicates the stage of HUMAnN 3’s tiered search where sample reads were aligned; ~75% of most samples’ reads were explained, with the vast majority of the reads assigned by known pangenomes outside of the CAMI mousegut samples (which relied more heavily on translated search for explanations). The ‘CPU-HRS’ row indicates the time spent in various phases of HUMAnN 3’s tiered search, with the translated search step dominating overall runtime. The MaxRSS row indicates the peak memory usage (in GBs) for each sample, and was consistently in the 20–25 GB range.