. 2021 Apr 6;10:e65836. doi: 10.7554/eLife.65836

Figure 1. Colistin disrupts the outer membrane but not the cytoplasmic membrane of E. coli expressing mcr-1.

(A) Quantification of LPS modified with phosphoethanolamine, expressed as the percentage of unmodified lipid A and unmodified lipid A, in whole cells and spheroplasts of E. coli MC1000 expressing mcr-1, as determined by MALDI-TOF-based lipidomics (n = 3 in duplicate, *p<0.05 between Whole Cells and Spheroplasts). (B) OM disruption of E. coli MC1000 cells expressing mcr-1 or an empty plasmid control strain (pEmpty) during 10 min of exposure to colistin at the indicated antibiotic concentrations, as determined by uptake of the fluorescent dye NPN (10 µM) (n = 5, each data point represents the arithmetic mean of 20 replicate measurements; ns: p>0.05 between pEmpty and mcr-1 strains, *p<0.05 between the indicated concentrations of colistin). (C) Permeabilisation of the CM of E. coli MC1000 cells expressing mcr-1 or empty plasmid-containing cells during incubation with colistin (4 µg ml−1), as determined using 2.5 µM propidium iodide (PI) (n = 4; *p<0.0001 between pEmpty and mcr-1 strains). (D) Growth or lysis of E. coli MC1000 cells expressing mcr-1 or empty plasmid control cells during exposure to colistin (4 µg ml−1), as measured using OD595nm readings (n = 4; *p<0.05 between pEmpty and mcr-1 strains). Data in (A) were analysed by a two-tailed paired Student’s t-test. Data in (B–D) were analysed by a two-way ANOVA with Sidak’s (B) or Dunnett’s (C, D) post hoc tests. Data are presented as the arithmetic mean, and error bars represent the standard deviation of the mean. OM: outer membrane; NPN: N-phenyl-1-naphthylamine; CM: cytoplasmic membrane; r.f.u.: relative fluorescence units; OD: optical density.

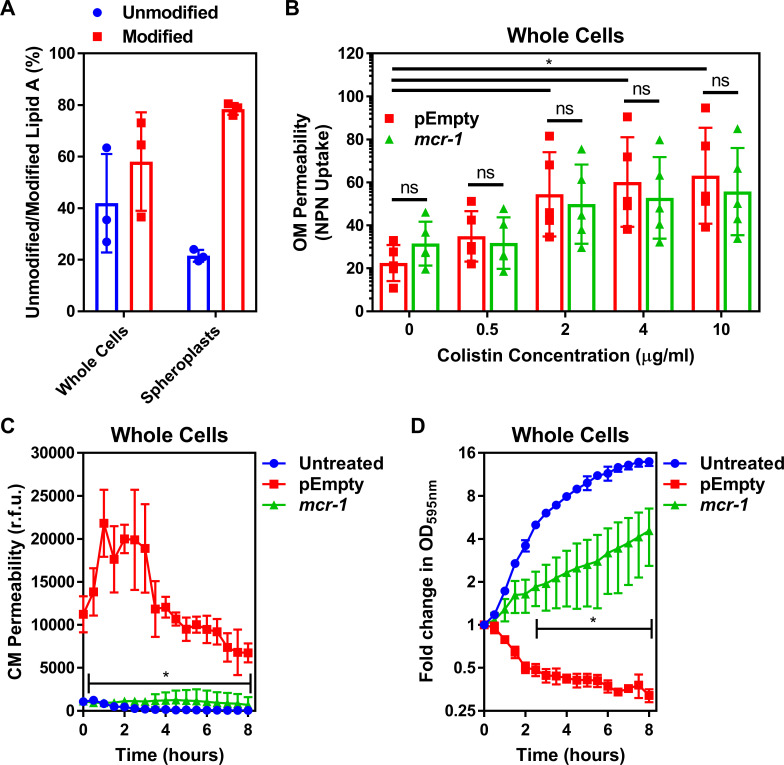
Figure 1.

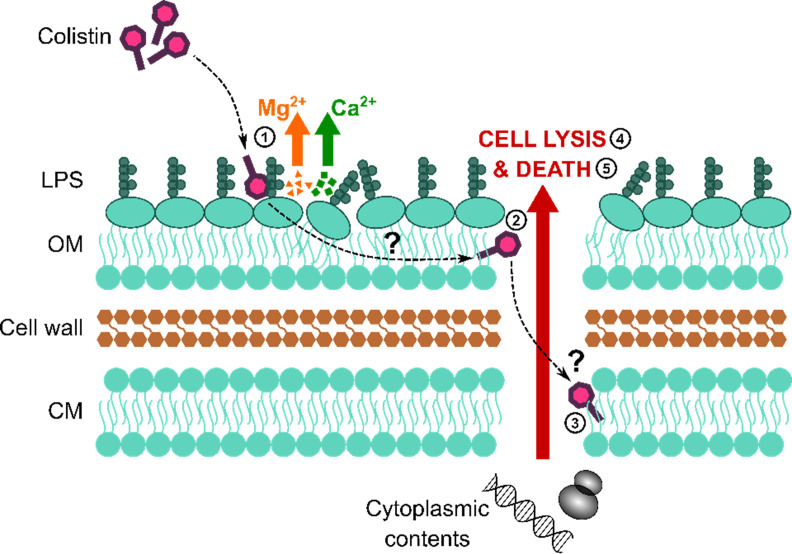
Figure 1—figure supplement 1. Colistin causes outer membrane (OM) disruption, but the process by which this leads to cytoplasmic membrane (CM) damage and bacterial lysis is not known.

Figure 1—figure supplement 1.

Diagrammatic representation of the current hypothesised mechanism of action of colistin: (1) Colistin binds to LPS in the OM, causing displacement of cations that form bridges between LPS molecules and leading to membrane disruption. (2) The antibiotic then crosses the OM via a process termed ‘self-directed uptake’. (3) Colistin subsequently disrupts the CM through a mechanism that remains unclear. (4, 5) Once the cell envelope is permeabilised, the bacteria lyse and are killed.
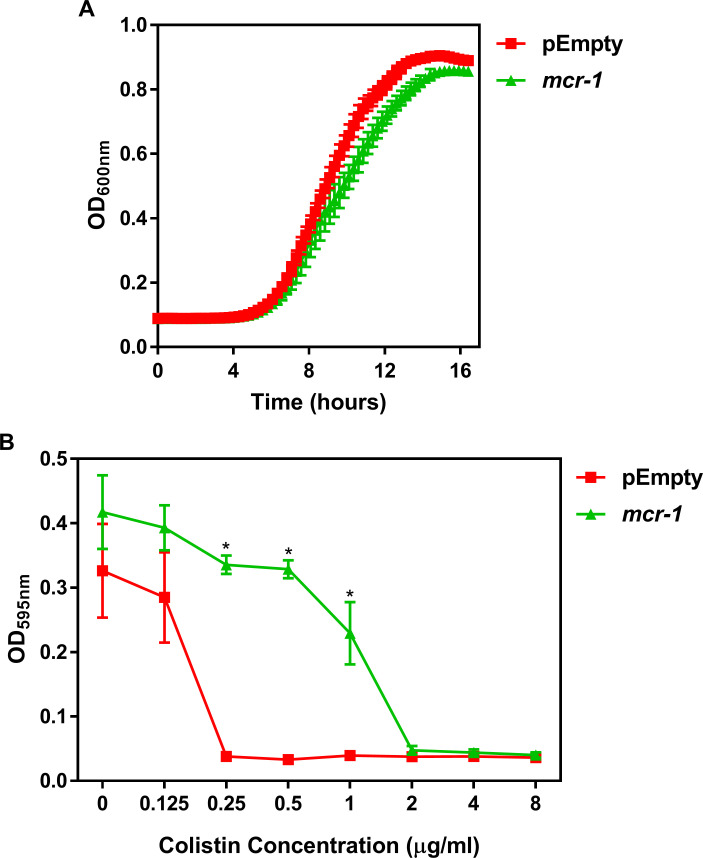
Figure 1—figure supplement 2. Characterisation of the E. coli MC1000 strain harbouring a plasmid encoding the colistin resistance gene mcr-1, and an MC1000 strain containing the pDM1 plasmid only (pEmpty) as a control strain.

Figure 1—figure supplement 2.

(A) Growth of E. coli MC1000 cells containing an empty pDM1 plasmid (pEmpty) or MC1000 cells containing the pDM1 plasmid expressing the mcr-1 gene, as determined by measuring OD600nm over 16 hr incubation at 37°C (n = 3 in triplicate). (B) Final growth densities of E. coli MC1000 cells with an empty pDM1 plasmid and MC1000 cells harbouring the pDM1 plasmid encoding the mcr-1 gene in MHB media containing the indicated concentrations of colistin, as determined by measuring OD595nm after 18 hr incubation (n = 3 in triplicate; *p<0.0001 compared to pEmpty strain). Expression of the mobilised colistin resistance determinant mcr-1 by E. coli MC1000 bacteria resulted in only a minor growth defect relative to empty plasmid-containing control cells (A). As expected, E. coli MC1000 cells producing MCR-1 had an eightfold increase in the MIC of colistin in comparison to the isogenic empty plasmid strain (2 μg ml−1 versus 0.25 μg ml−1) (B). This confirmed that the bacteria harbouring a plasmid with the mcr-1 gene were resistant to colistin. Data in B were analysed by a two-way ANOVA with Sidak’s post hoc test. Data are presented as the arithmetic mean, and error bars represent the standard deviation of the mean.
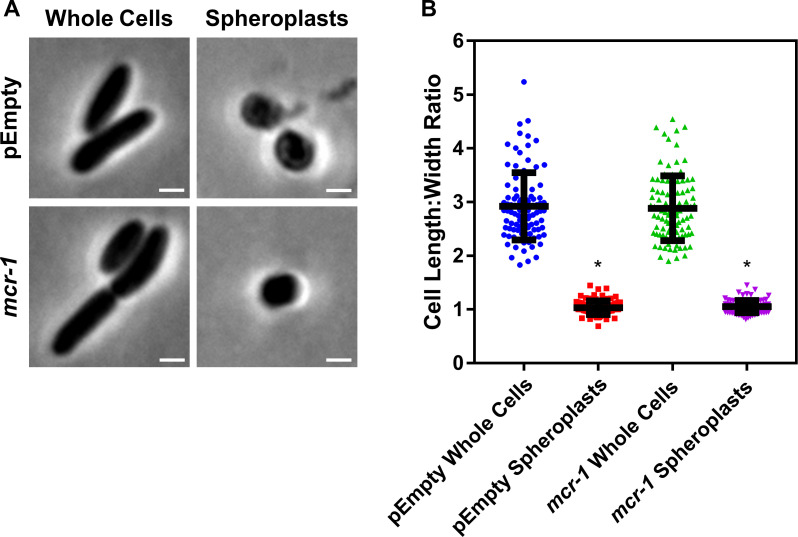
Figure 1—figure supplement 3. Formation of E. coli pEmpty and mcr-1 spheroplasts.

Figure 1—figure supplement 3.

(A) Representative phase contrast micrographs of E. coli MC1000 cells harbouring an empty pDM1 plasmid (pEmpty) or a pDM1 plasmid expressing the colistin-resistance determinant mcr-1 before (Whole Cells) and after (Spheroplasts) treatment with 0.25 mg ml−1 EDTA (to remove the outer membrane [OM]) and 1 mg ml−1 lysozyme (to remove the cell wall) for 1 hr at 30°C, followed by the addition of trypsin (0.5 mg ml−1) for 15 min, with all incubations occurring in Tris buffer (0.03 M, pH 8.0) containing 20% sucrose (Scale bars: 5 μm). (B) Quantification of length:width ratio of E. coli MC1000 cells containing an empty plasmid, or E. coli cells with the same plasmid encoding the mcr-1 gene, before (Whole Cells) and after (Spheroplasts) exposure to EDTA, lysozyme and trypsin (A) (n = 100 cells per group; *p<0.0001 compared to the respective Whole Cells). Removal of the OM and cell wall from both E. coli MC1000 pEmpty and mcr-1-expressing bacteria results in the formation of round cells with a length:width ratio of ~1 (A, B), confirming the successful production of E. coli spheroplasts lacking the OM and cell wall. Data in B were analysed by a one-way ANOVA with Tukey’s post hoc test. Data are presented as the arithmetic mean, and error bars represent the standard deviation of the mean.
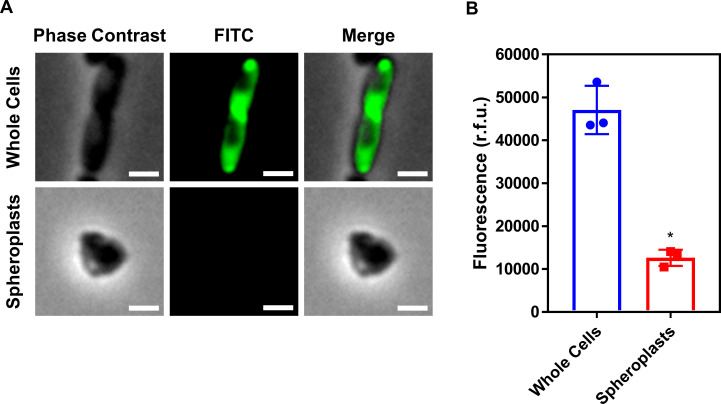
Figure 1—figure supplement 4. Conversion of E. coli whole cells to spheroplasts results in removal of the OM, and no OM contamination in the CM.

Figure 1—figure supplement 4.

(A) Representative fluorescence microscopy images of E. coli MC1000 pEmpty cells labelled with fluorescein isothiocyanate (FITC, 0.5 mg ml−1) before (Whole Cells) and after (Spheroplasts) conversion to spheroplasts with EDTA (0.25 mg ml−1) and lysozyme (1 mg ml−1) in Tris buffer (0.03 M, pH 8.0) containing 20% sucrose, as described in Figure 1—figure supplement 6 (Scale bars: 5 μm). (B) Quantification of fluorescence from FITC-labelled E. coli MC1000 pEmpty cells before (Whole Cells) and after (Spheroplasts) conversion to spheroplasts (n = 3 in triplicate; *p<0.01 compared to Whole Cells). Proteins in the OM of whole E. coli MC1000 cells were tagged with a FITC fluorophore for 30 min, as previously described (Wiegand et al., 2008). Following conversion of these labelled bacterial cells to spheroplasts, there was virtually no fluorescence from FITC visible by microscopy (A), or when quantifying the entire cell population (B). This confirmed that the OM had been successfully removed during the formation of spheroplasts, and that there was no contamination of the CM with material from the OM. Data in B were analysed by a paired Student’s t-test. Data are presented as the arithmetic mean, and error bars represent the standard deviation of the mean.
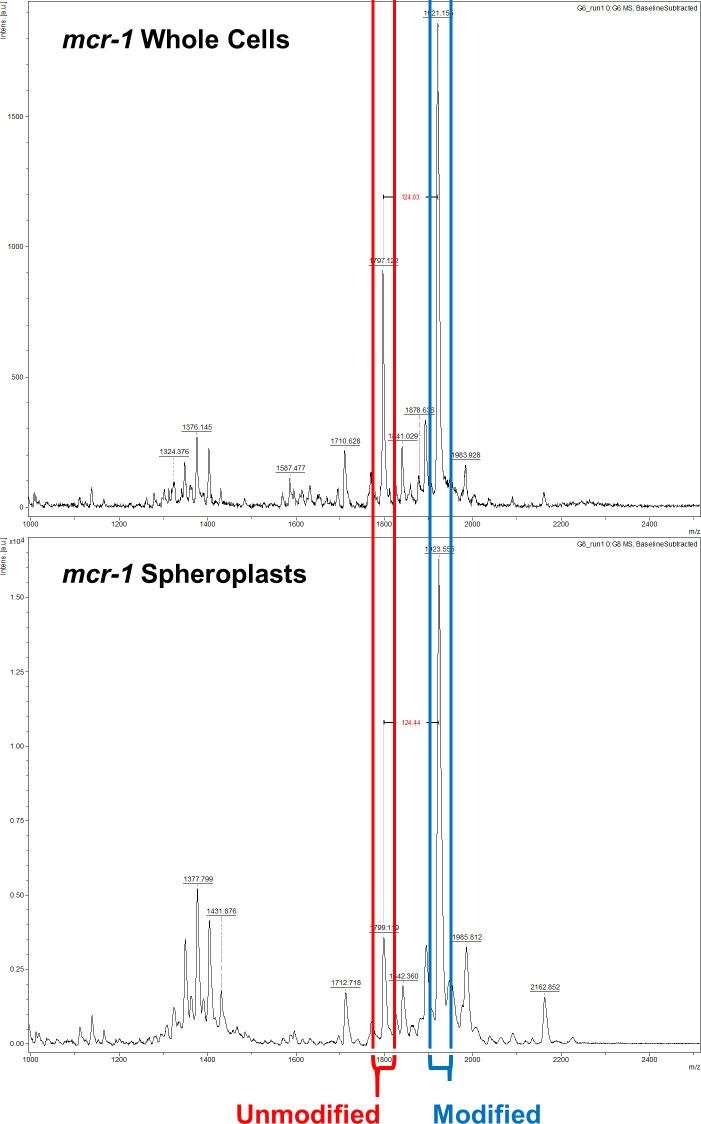
Figure 1—figure supplement 5. The ratio of modified lipid A to unmodified lipid A is significantly greater in the cytoplasmic membrane (CM) than in the outer membrane (OM) of E. coli expressing mcr-1.

Figure 1—figure supplement 5.

Representative mass spectra showing the ratio of unmodified lipid A (red) to lipid A modified with phosphoethanolamine (blue) in whole cells and spheroplasts of E. coli MC1000 expressing mcr-1, as determined by MALDI-TOF-based lipidomics. There was a higher proportion of LPS modified with pETN in mcr-1-expressing E. coli MC1000 spheroplasts compared to whole E. coli MC1000 cells, demonstrating that there is an increased abundance of unmodified LPS in the OM compared to the CM.
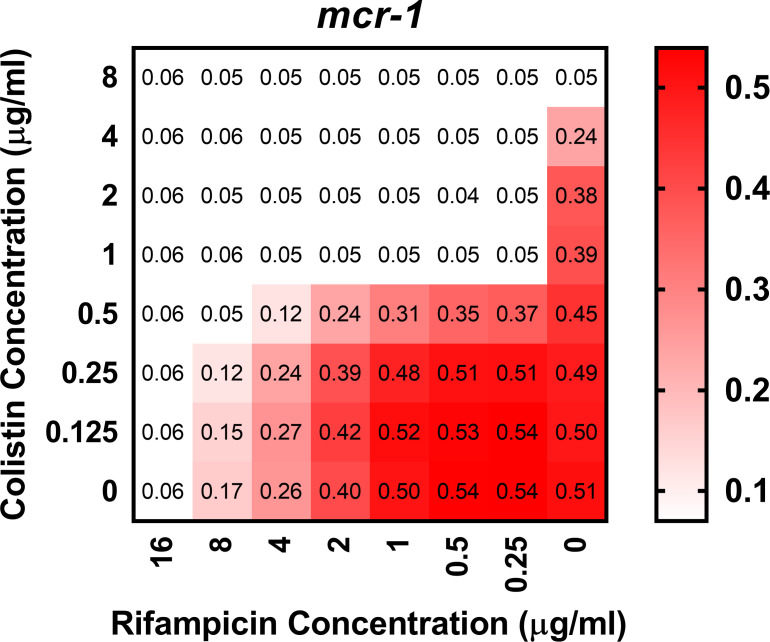
Figure 1—figure supplement 6. Colistin potentiates the activity of rifampicin against colistin-resistant E. coli expressing mcr-1.

Figure 1—figure supplement 6.

Checkerboard broth microdilution assay showing the synergistic growth-inhibitory activity of colistin and rifampicin against E. coli MC1000 cells producing MCR-1, as determined by measuring OD600nm after 18 hr incubation. Gram-negative bacteria including E. coli are intrinsically resistant to rifampicin, due to its inability to penetrate the OM of the cell envelope and access its intracellular target (MacNair et al., 2018). However, colistin and rifampicin displayed potent synergy against mcr-1-expressing E. coli, with a fractional inhibitory concentration index (FICI) value of 0.14. This indicated that colistin was enabling rifampicin to cross the OM and enter the cytoplasm, providing further evidence that colistin was able to disrupt the OM of resistant bacteria producing MCR-1.