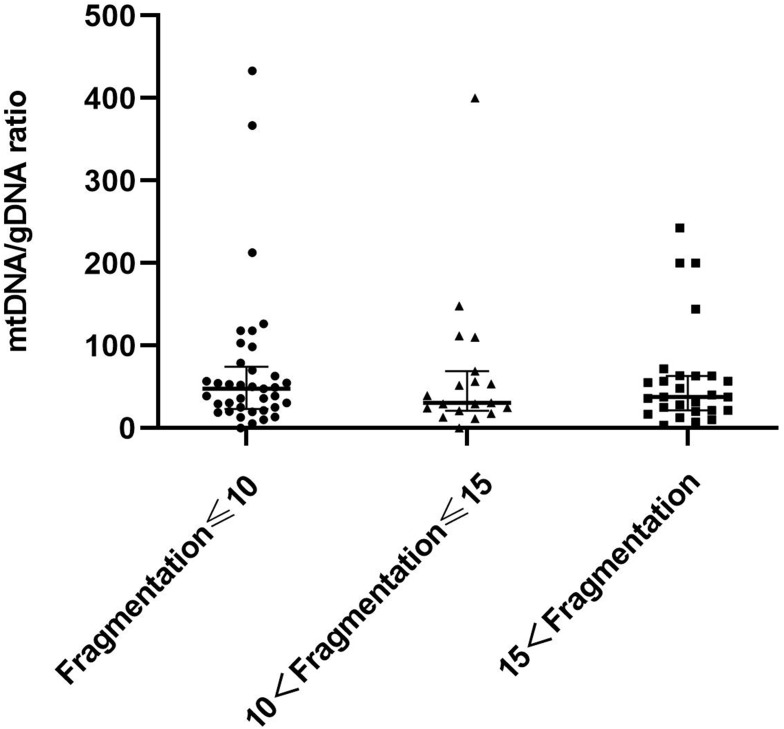
Figure 5.
Group comparison of cleavage stage embryo fragments without blastocyst formation. Fragmentation of embryos in the first group was ≤10% (n = 37), the fragment content of embryos in the second group between 10% and 15% (n = 18), fragmentation of embryos in the third group was >15% (n = 27). One black dot, black triangle, or black square represents one sample. Data are presented as the median with interquartile ranges (Q1–Q3).

