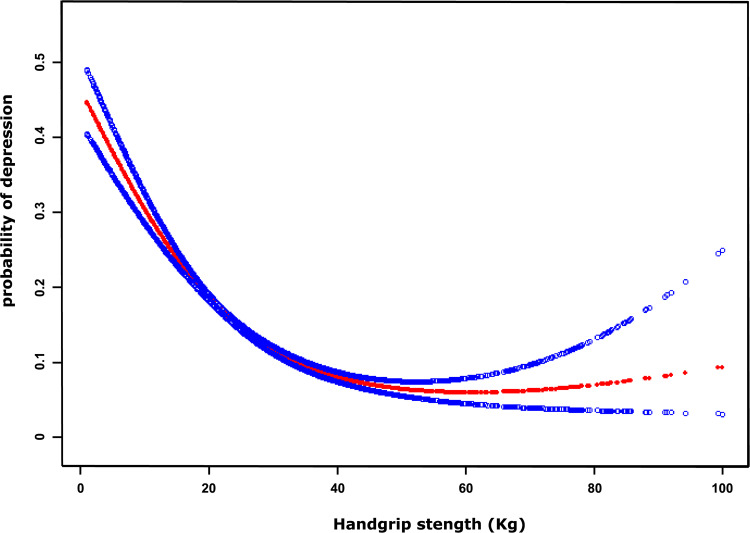
Figure 1.
A nonlinear relationship between handgrip strength and probability of depression by a generalized additive model after adjusting for age, sex, BMI, frailty, and cognitive impairment. The red dotted lines represent the estimated risk of depression, and the blue dotted lines indicate the 95% CI of the spline plots.

