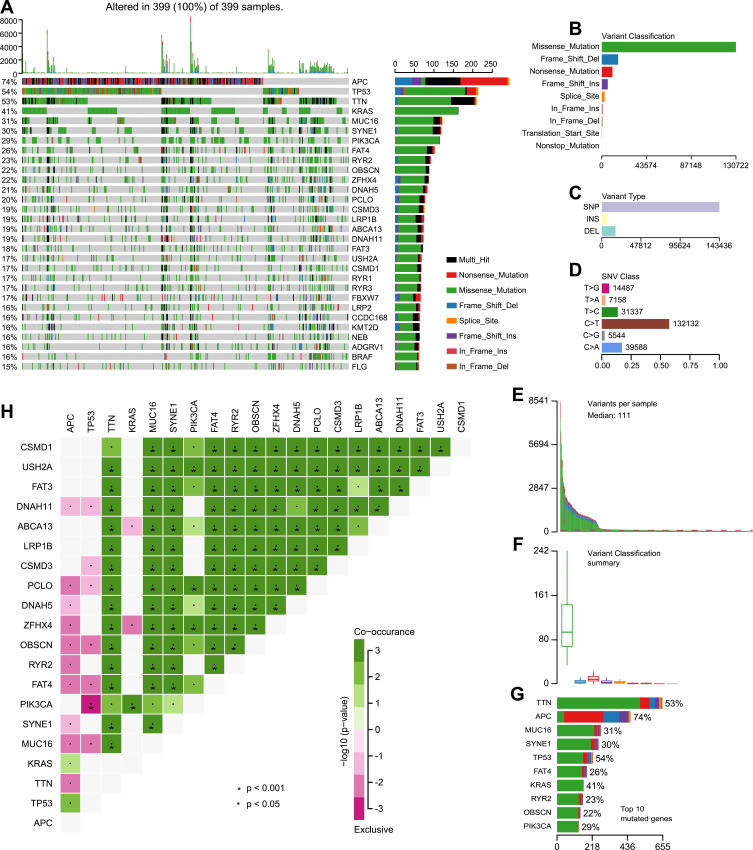
Figure 1.
Landscape of mutational profiles in colon cancer patients. (A) Mutation information of each gene in each patient is shown in the waterfall plot; various colors with annotations on the right represented the different mutation types. The barplot exhibited the mutation burden. (B) Classification of mutation types according to different categories; missense mutation accounts for the most fraction. (C) Single nucleotide polymorphism (SNP) showing a larger proportion than insertion or deletion. (D) In single nucleotide variants (SNV); C>T occurred most frequently. (E and F) Tumor mutation burden in samples. (G) The top 10 mutated genes in colon cancer. (H) The coincident and exclusive relationships of mutated genes.

