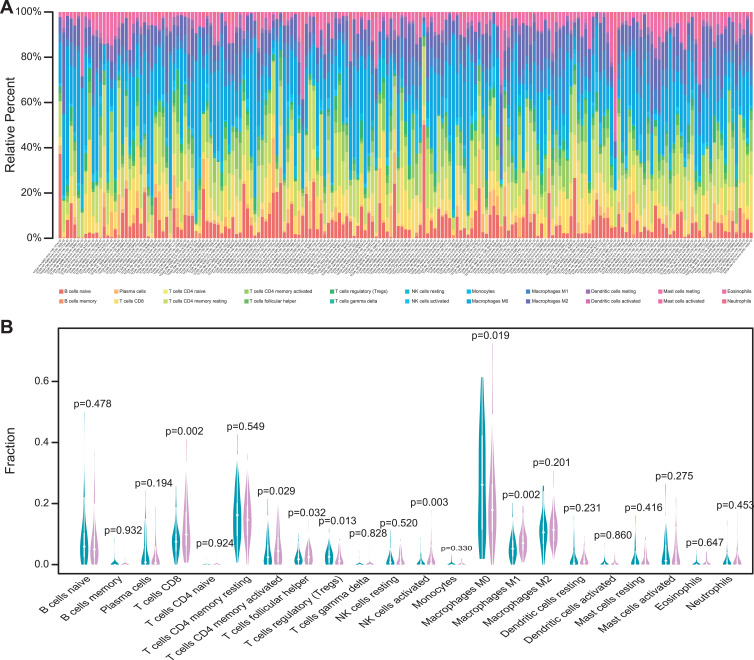
Figure 3.
Comparisons of 22 important immune fractions between low- and high-TMB groups. (A) Barplot showing the specific 22 immune cells percentages displayed by different colors in each sample. (B) Wilcoxon rank-sum test revealed the different infiltration levels of immune cells between low- and high-TMB groups. Blue represented low-TMB group, red represented high-TMB group.

