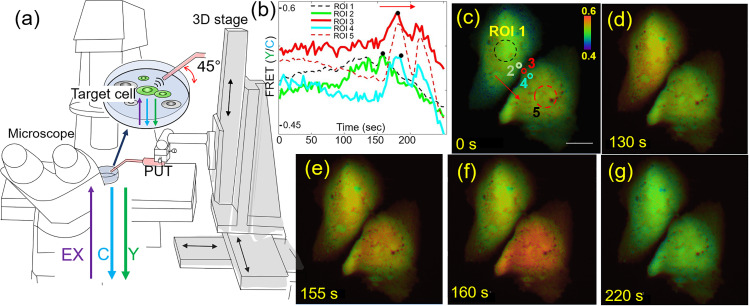
FIG. 5.
(a) PUT with 130 MHz center frequency stimulates a target cell expressing FRET biosensor to detect calcium transport between cells. PUT position is controlled by 3D stage. Microscope was used to image FRET changes of target cells after the stimulation using the intensity ratio between ECFP (C) and YPet (Y). (b) and (c) Time course changes of FRET of ROIs 1–5. ROI 1 is in the middle of the target cell and ROI 5 is in the middle of a neighboring cell. ROIs 2–4 are sequentially located from the stimulated target cell to the neighboring cell. Black dots indicate maximum FRET of ROIs 2–4. FRET changes of ROIs 2–4 indicate calcium transport as indicated red arrows and black dots on the FRET plot. A scale bar indicates 20 μm. The color scale bar in panel (c) represents the range of FRET ratio with purple and red colors, indicating low and high levels of calcium concentration, respectively. (d)–(g) FRET images of two cells at the designated time.

