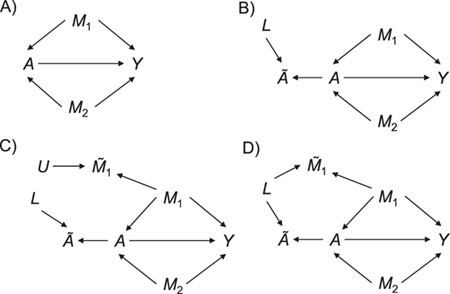
Figure 1.

Causal diagrams guiding a student’s simulation of nondifferential misclassification. A) No misclassification; B) nondifferential misclassification of exposure  (with no misclassification of confounder
  ); C) nondifferential misclassification of
  that is independent of the nondifferential misclassification of
  ; D) nondifferential misclassification of
  that is dependent on the nondifferential misclassification of
  .
.
