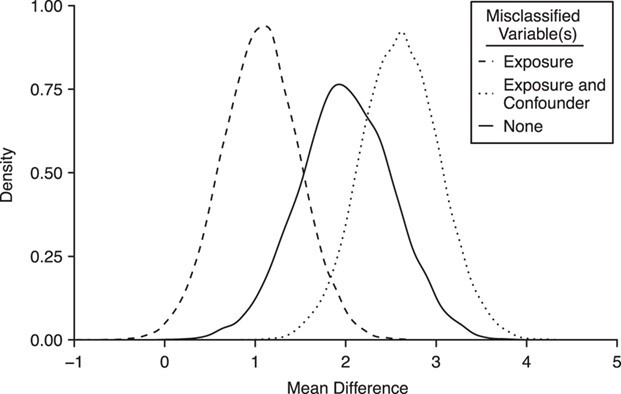
Figure 2.

Distribution of mean difference estimates, comparing the mean difference under no misclassification with the mean difference under nondifferential misclassification of only the binary exposure  and nondifferential misclassification of
  and of the confounder
  , with the misclassification errors being dependent.
